Identifying Mammary Epithelial Cells

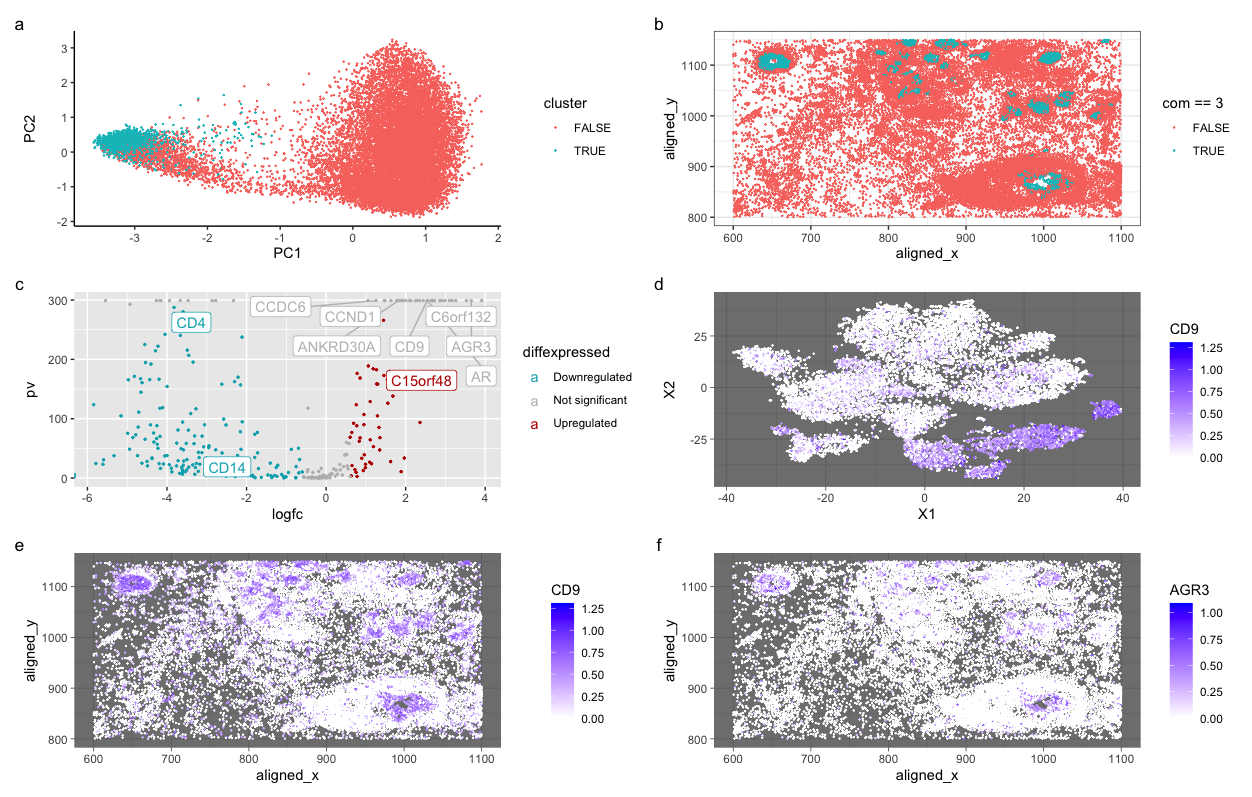
My figure features cluster 3 and links the expression of a known breast cancer gene in mammary epithelial cells to cluster 3. Further investigation showed two genes expressed in mammary epithelial cells, CD9 and AGR3.
I clustered the Pickachu data set into 7 clusters and then chose a cluster based on the expression of gene CDH1, which is a known gene linked to breast cancer. Then, I looked for differentially expressed genes in mammary cells. Both genes are known to be expressed in mammary epithelial cells. In a few resources, I discovered that CD9 is linked to tumors associated with breast cancer, and it can appear in epithelial cells. As the figures show, both genes are active within the cells and are predominantly spatially expressed in a few clusters. I have identified mammary cells by linking two known epithelial genes to a breast cancer gene in the same cluster and confirming with literature that these genes are expressed in mammary cells. To further validate my conclusion, I also know the cells came from breast cancer tissue. This helped me confirm that these cells expressing the genes are correctly classified with mammary cells instead of other cell types.
Sources:
- https://www.nature.com/articles/nrc2543
- https://pubmed.ncbi.nlm.nih.gov/37141396/
- https://www.nationalbreastcancer.org/other-breast-cancer-genes/ lists common breast cancer genes.
- https://pathology.jhu.edu/breast/types-of-breast-cancer:~:text=Carcinomas%20are%20cancers%20that%20arise,are%20responsible%20for%20making%20milk.
- https://ejbc.kr/DOIx.php?id=10.4048/jbc.2019.22.e9
- https://www.nature.com/articles/nrc2543
- https://www.proteinatlas.org/ENSG00000039068-CDH1
- https://www.genecards.org/cgi-bin/carddisp.pl?gene=AGR3
- https://www.ncbi.nlm.nih.gov/pmc/articles/PMC6781763/#:~:text=Similarly%2C%20AGR3%20is%20also%20an,several%20clinical%20entities%2C%20including%20cancer.
- https://www.google.com/searchq=RET)+gene+fusion&oq=RET)+gene+fusion&gs_lcrp=EgZjaHJvbWUyBggAEEUYOTIICAEQABgWGB4yCAgCEAAYFhgeMggIAxAAGBYYHjIICAQQABgWGB4yCAgFEAAYFhgeMg0IBhAAGIYDGIAEGIoFMg0IBxAAGIYDGIAEGIoFMg0ICBAAGIYDGIAEGIoFMg0ICRAAGIYDGIAEGIoF0gEIMTA2MGowajeoAgCwAgA&sourceid=chrome&ie=UTF-8
library(ggplot2)
library(gridExtra)
library(Rtsne)
library(ggrepel)
library(patchwork)

data <- read.csv('~/Documents/genomicsDataVisualization/pikachu.csv.gz', row.names = 1)
gexp <- data[, 6:ncol(data)]
geneNames <- data[0, 6:ncol(data)]
pos <- data[, 4:5]
gexpnorm <- log10(gexp/rowSums(gexp) * mean(rowSums(gexp)) + 1)

#pca
pcs <- prcomp(gexpnorm)
emb <- Rtsne(pcs$x[, 1:20])$Y

# kmeans
plot(pcs$sdev[1:30])
com <- as.factor(kmeans(gexpnorm, centers = 7)$cluster)

# visualize clusters
ggplot(data.frame(emb,com)) + geom_point(aes(x = X1, y = X2, col = com), size = 0.1) + theme_bw()

# cluster of interest com == 3
g <- 'CDH1' # known cancer gene
results <- sapply(unique(com), function(i) {
  wilcox.test(gexpnorm[com == i, g],
              gexpnorm[com != i, g],
              alternative = "greater")$p.val
})
head(sort(results, decreasing=FALSE))

g <- 'CDH1'
results <- sapply(colnames(gexpnorm), function(g) {
  wilcox.test(gexpnorm[com == 3, g],
              gexpnorm[com != 3, g],
              alternative = "greater")$p.val
})
head(sort(results, decreasing=FALSE)) # showed which cluster was expressed highly of gene

# AGR3 ANKRD30A       AR C6orf132    CCND1      CD9

pcsNorm <- prcomp(gexpnorm, center = TRUE, scale = FALSE)
df <- data.frame(pcsNorm$x[, 1:15], cluster = com == 3)
p1 <- ggplot(df) +
  geom_point(aes(x = PC1, y = PC2, col = cluster), size = 0.1) +
  theme_classic()

# cluster 3 in physical space
p2 <- ggplot(data) + geom_point(aes(x = aligned_x, y = aligned_y, col = com == 3), size = 0.1) + theme_bw()

# volcano differentially expressed genes in cluster 3
pv <- sapply(colnames(gexpnorm), function(i) {
  wilcox.test(gexpnorm[com == 3, i], gexpnorm[com != 3, i])$p.val
})
logfc <- sapply(colnames(gexpnorm), function(i) {
  log2(mean(gexpnorm[com == 3, i])/mean(gexpnorm[com != 3, i]))
})

# volcano plot
# https://biostatsquid.com/volcano-plots-r-tutorial/ used code from here
# got assistance from copiolt to get the labels correct

df <- data.frame(pv=-log10(pv + 10e-300), logfc) # adjust by the 300 bc most points are inf
df$geneNames <- t(geneNames)
df$diffexpressed <- "NO"
df$diffexpressed[df$logfc > 0.6 & df$pv < 290] <- "UP"
df$diffexpressed[df$logfc < -0.6 & df$pv < 290] <- "DOWN"
genes_of_interest <- c("CD4","CCND1", "AGR3", "ANKRD30A", "C6orf132", "CD14", "CD9", "CCDC6", "C15orf48", "AR")
df$label <- ifelse(rownames(df) %in% genes_of_interest, rownames(df), NA)
p3 <- ggplot(df, aes(x = logfc, y = pv, col = diffexpressed, label = label)) +
      geom_point(size = 0.5, key_glyph = "point") +
      geom_label_repel(max.overlaps = 20) +
      scale_color_manual(values = c("#00AFBB", "grey", "#bb0c00"),
                     labels = c("Downregulated", "Not significant", "Upregulated")) +
  geom_segment(aes(x = logfc, y = pv, xend = logfc, yend = pv + 0.05), color = "black")

# Rtsne space of differentially expressed gene
p4 <- ggplot(data.frame(emb, CD9 = gexpnorm[, 'CD9'])) +
  geom_point(aes(x = X1, y = X2, col = CD9), size = 0.1) +
  scale_colour_gradient2(low = 'blue', mid = 'white', high = 'blue') + theme_dark()

# gene in physical space
p5 <- ggplot(data.frame(pos, gexpnorm)) +
  geom_point(aes(x = aligned_x, y = aligned_y, col = CD9), size = 0.1) +
  scale_colour_gradient2(low = 'blue', mid = 'white', high = 'blue') +
  theme_dark()

p6 <- ggplot(data.frame(pos, gexpnorm)) +
  geom_point(aes(x = aligned_x, y = aligned_y, col = AGR3), size = 0.1) +
  scale_colour_gradient2(low = 'blue', mid = 'white', high = 'blue') +
  theme_dark()

p1 + p2 + p3 + p4 + p5 + p6 + plot_annotation(tag_levels = 'a') + plot_layout(ncol = 2)

# https://www.nature.com/articles/nrc2543 discusses CD9 is used mostly for tumor suppression
# it helps with tumor suppression in conjuction of signalling proteins
# https://pubmed.ncbi.nlm.nih.gov/37141396/ discusses RET mutation with CCDC6 which was 3rd highest expressed gene associated with both CTLA4 and CDH1 which are both known breast cancer genes
# both of these genes are active within the cells as the figures show. I believe I have successfully classified breast cancer cells
# https://www.nationalbreastcancer.org/other-breast-cancer-genes/ that lists common breast cancer genes