PCA with Non-normalized and Normalized Data

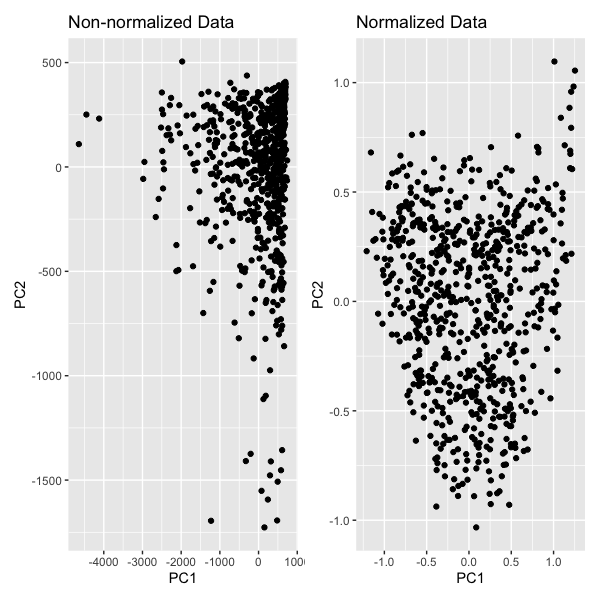
With this visualization, we are comparing PCA with non-normalized and normalized data. We are encoding the categorical data, spots, using the geometric primitive of point. We encoded the quantitative data, PC1, using position on the x-axis. We also encoded the quantitaive data, PC2, using position on the y-axis. We created two plots similar plots, one in which PCA was conducted on non-normalized gene expression data and one in which PCA was conducted on normalized gene expression data. Normalization was done by taking the logarithm and using a scale factor of 100. We see that normalization scales the data so it better captures the variance.
library(Rtsne)
library(patchwork)

dim(data)
data[1:10, 1:10]

pos<-data[,2:3]
gexp<-data[,4:ncol(data)]

topgene<-names(sort(apply(gexp, 2, var), decreasing=TRUE)[1:1000])

gexpfilter<-gexp[,topgene]
dim(gexpfilter)

gexpfilternorm <- log10(gexpfilter/rowSums(gexpfilter)*100 + 1)

pcsfilter<-prcomp(gexpfilter)
pcsnorm<-prcomp(gexpfilternorm)

p1<-ggplot(as.data.frame(pcsfilter$x))+geom_point(aes(x=PC1,y=PC2))+ggtitle("Non-normalized Data")

p2<-ggplot(as.data.frame(pcsnorm$x))+geom_point(aes(x=PC1,y=PC2))+ggtitle("Normalized Data")
p1+p2