Visualization Critique

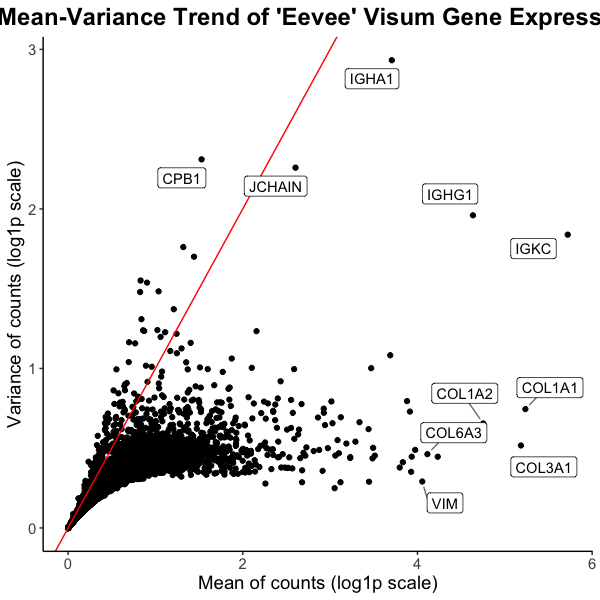
Caleb’s (challin1) visualization seeks to make more salient which genes have high mean or variance in expression. I believe this visualization is very effective because it uses position to encode quantitative data and utilizes the Gestalt principle of continuity to show a trend of points that have similar mean and variance. I believe it could be made more clear which genes have significantly high mean or variance, which could be done using some type of enclosure
# import libraries
library(here)
library(ggplot2)
library(tidyverse)
library(ggrepel)

# read in data
data = read.csv(here("eevee.csv.gz"), row.names = 1)

# QC
dim(data)
head(data)
colnames(data)
rownames(data)

# grab only genes and expression
X = data |>
  select(!c(barcode, aligned_x, aligned_y))

# log1p transform data
X = log1p(X)

# get mean and variance for each gene
mean_genes <- apply(X, 2, mean)
var_genes <- apply(X, 2, var)

# combine mean and variance into a data frame
mean_var_df <- data.frame(mean_genes, var_genes)

# add gene names as a column
mean_var_df$genes <- rownames(mean_var_df)
rownames(mean_var_df) <- NULL

# set seed for ggrepel
set.seed(44)

# plot
ggplot(mean_var_df) +
  # geom point for mean/variance
  geom_point(aes(x = mean_genes, y = var_genes)) +
  geom_abline(intercept = 0, slope = 1, color = "red") +
  # label high variance genes
  geom_label_repel(aes(x = mean_genes, y = var_genes, label=ifelse(var_genes>2, as.character(genes),'')),
                   box.padding   = 0.35,
                   point.padding = 0.5,
                   segment.color = 'grey50') +
  # label high mean genes
  geom_label_repel(aes(x = mean_genes, y = var_genes, label=ifelse(mean_genes>4, as.character(genes),'')),
                   box.padding   = 0.5,
                   point.padding = 0.5,
                   segment.color = 'grey50') +
  # theme
  theme_classic() +
  # labels
  labs(
    x = "Mean of counts (log1p scale)",
    y = "Variance of counts (log1p scale)",
    title = "Mean-Variance Trend of 'Eevee' Visum Gene Expression"
  ) +
  # text edit
  theme(
    plot.title = element_text(hjust = 0.5, face="bold", size=18),
    text = element_text(size = 14)
  )