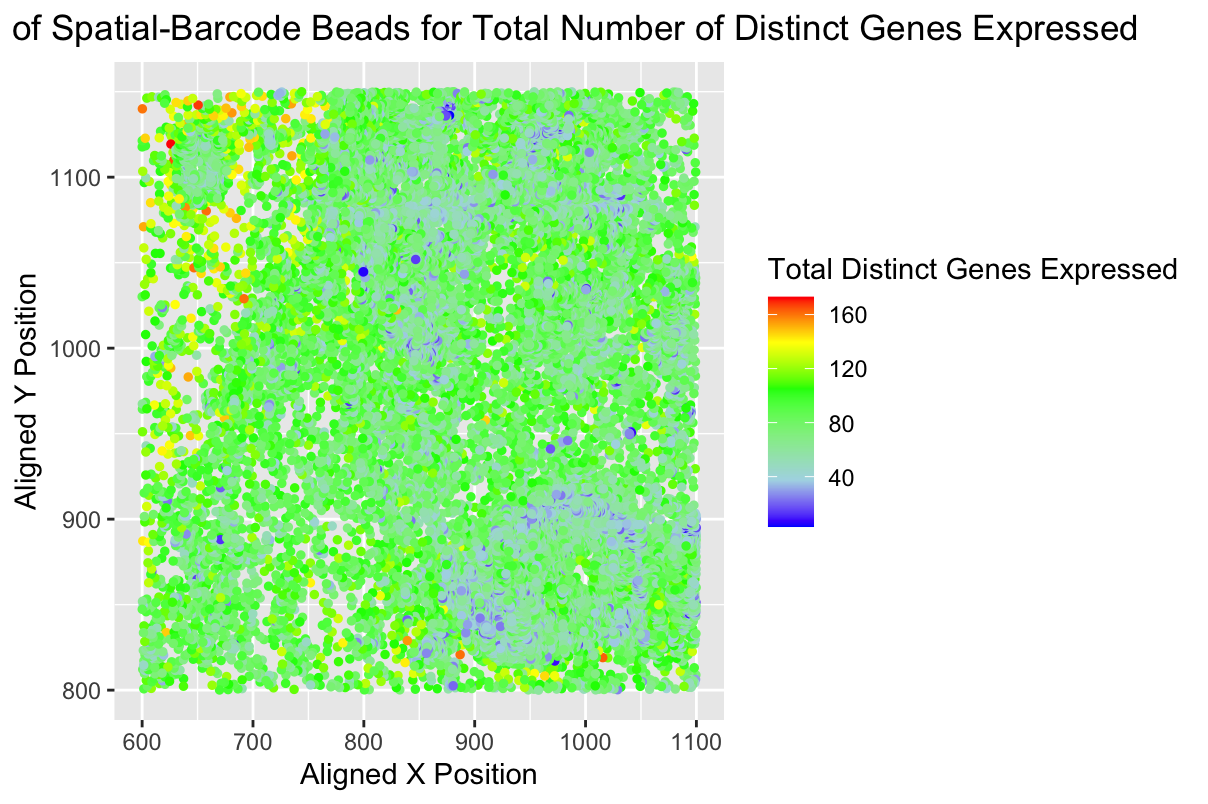
Spatial Localization of Total Number of Distinct Genes Expressed - Pikachu

Whose code are you applying? Provide a JHED
Jonathan Wang - jwang428
Critique the resulting visualization when applied to your data. Do you think the author was effective in making salient the point they said they wanted to make? How could you improve the data visualization in making salient the point they said they wanted to make? If you don’t think the data visualization can be improved, explain why the data visualization is already effective.
The author was effective in making salient the quantitative variety of genes expression across the sample, as well as the specific areas of higher genetic expression. By coloring the different expressed gene populations with different colors, it is clear where the most and least amount of genes were expressed. The visualization can be further improved by scaling the points so that areas where a greater number of genes are being expressed are represented in the image with a larger dot. This could be helpful in the pikachu dataset as there are more points and there are far less red points than green.