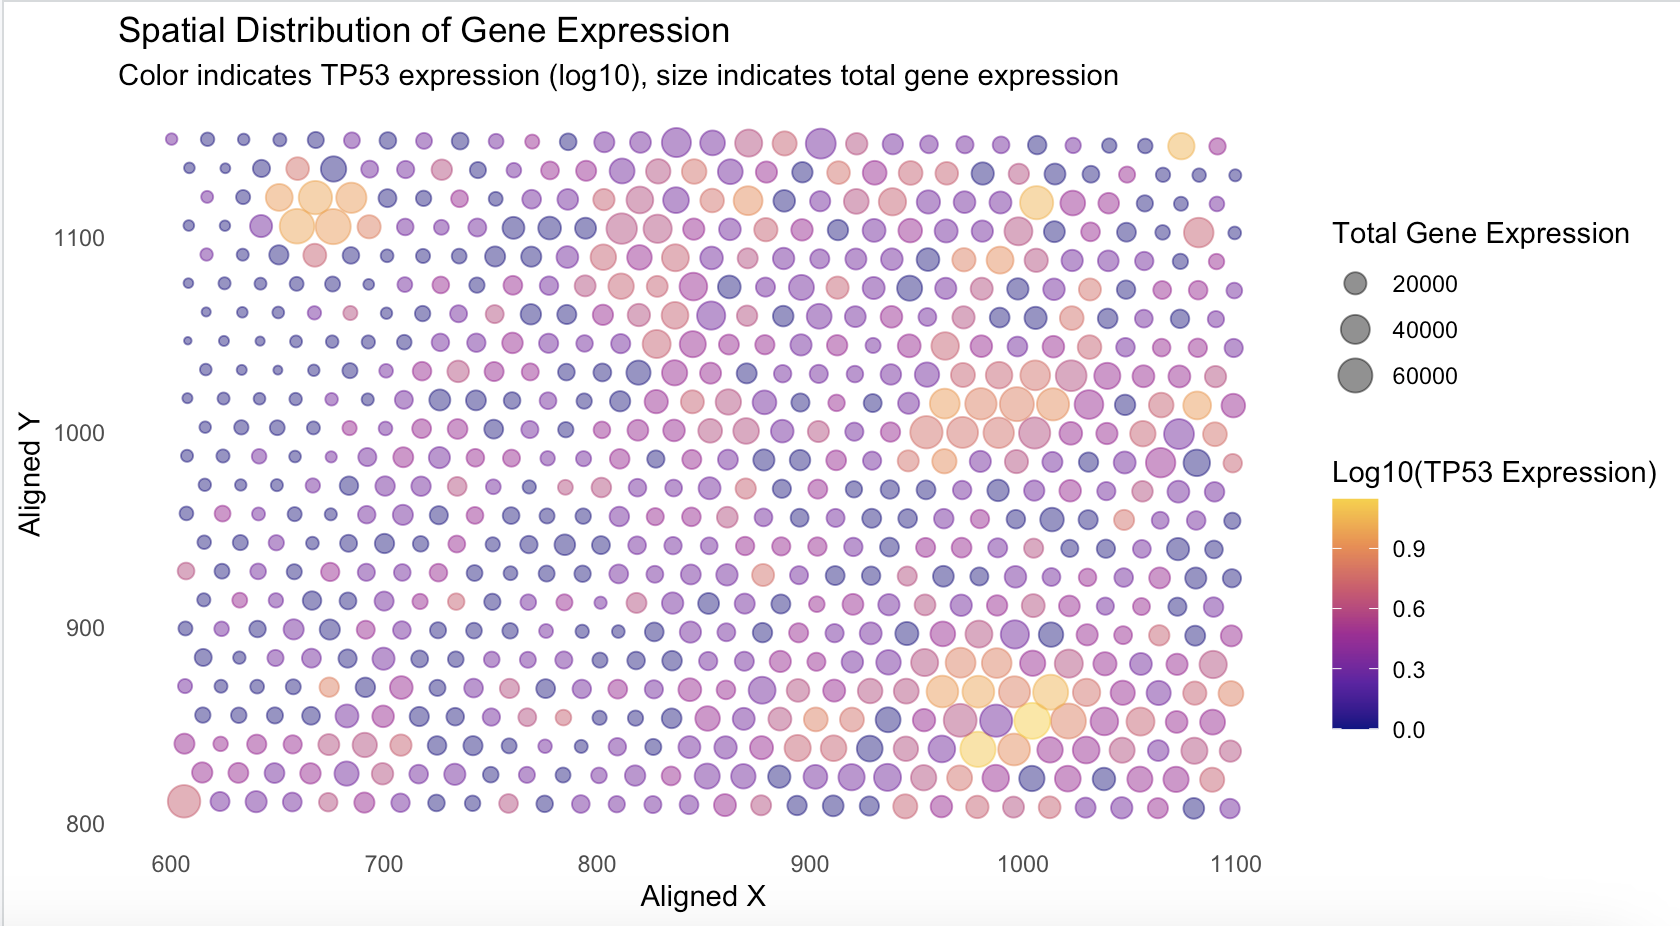
VCAN Expression versus x and y alignment in spacial-barcode bead capture

Whose code are you applying?
I’m applying Kiki Zhang’s code (JHED: szhan128)
Critique the resulting visualization when applied to your data. Do you think the author was effective in making salient the point they said they wanted to make? How could you improve the data visualization in making salient the point they said they wanted to make? If you don’t think the data visualization can be improved, explain why the data visualization is already effective.
I think this code is really effective at making salient the point that Kiki wanted to make. By using the visual primitives of size (quantitative), x-position (quantitative), y-position (quantitative), and color (quantitative), she was able to display the relationship between overall gene expression at each spot, along with the log-10 expression of TP53. By using the Gestalt prinicple of similarity, the viewer can group spots based on the color similarities as well as the size of the spot. The use of viridis color hue to represent quantitive data creates a high contrast visualization that makes it easy to understand. The use of x and y position to display the x and y alignment of each spot allows the viewers to not only gain an understanding of TP53 expression and total gene expression, but also where the spots are located in the sample. This uses another Gestalt prinicple of proximity, and views can extrapolate based on where similar color and similar sized spots are located.