Spatial variation in expression of CD4 gene

Whose code are you applying?
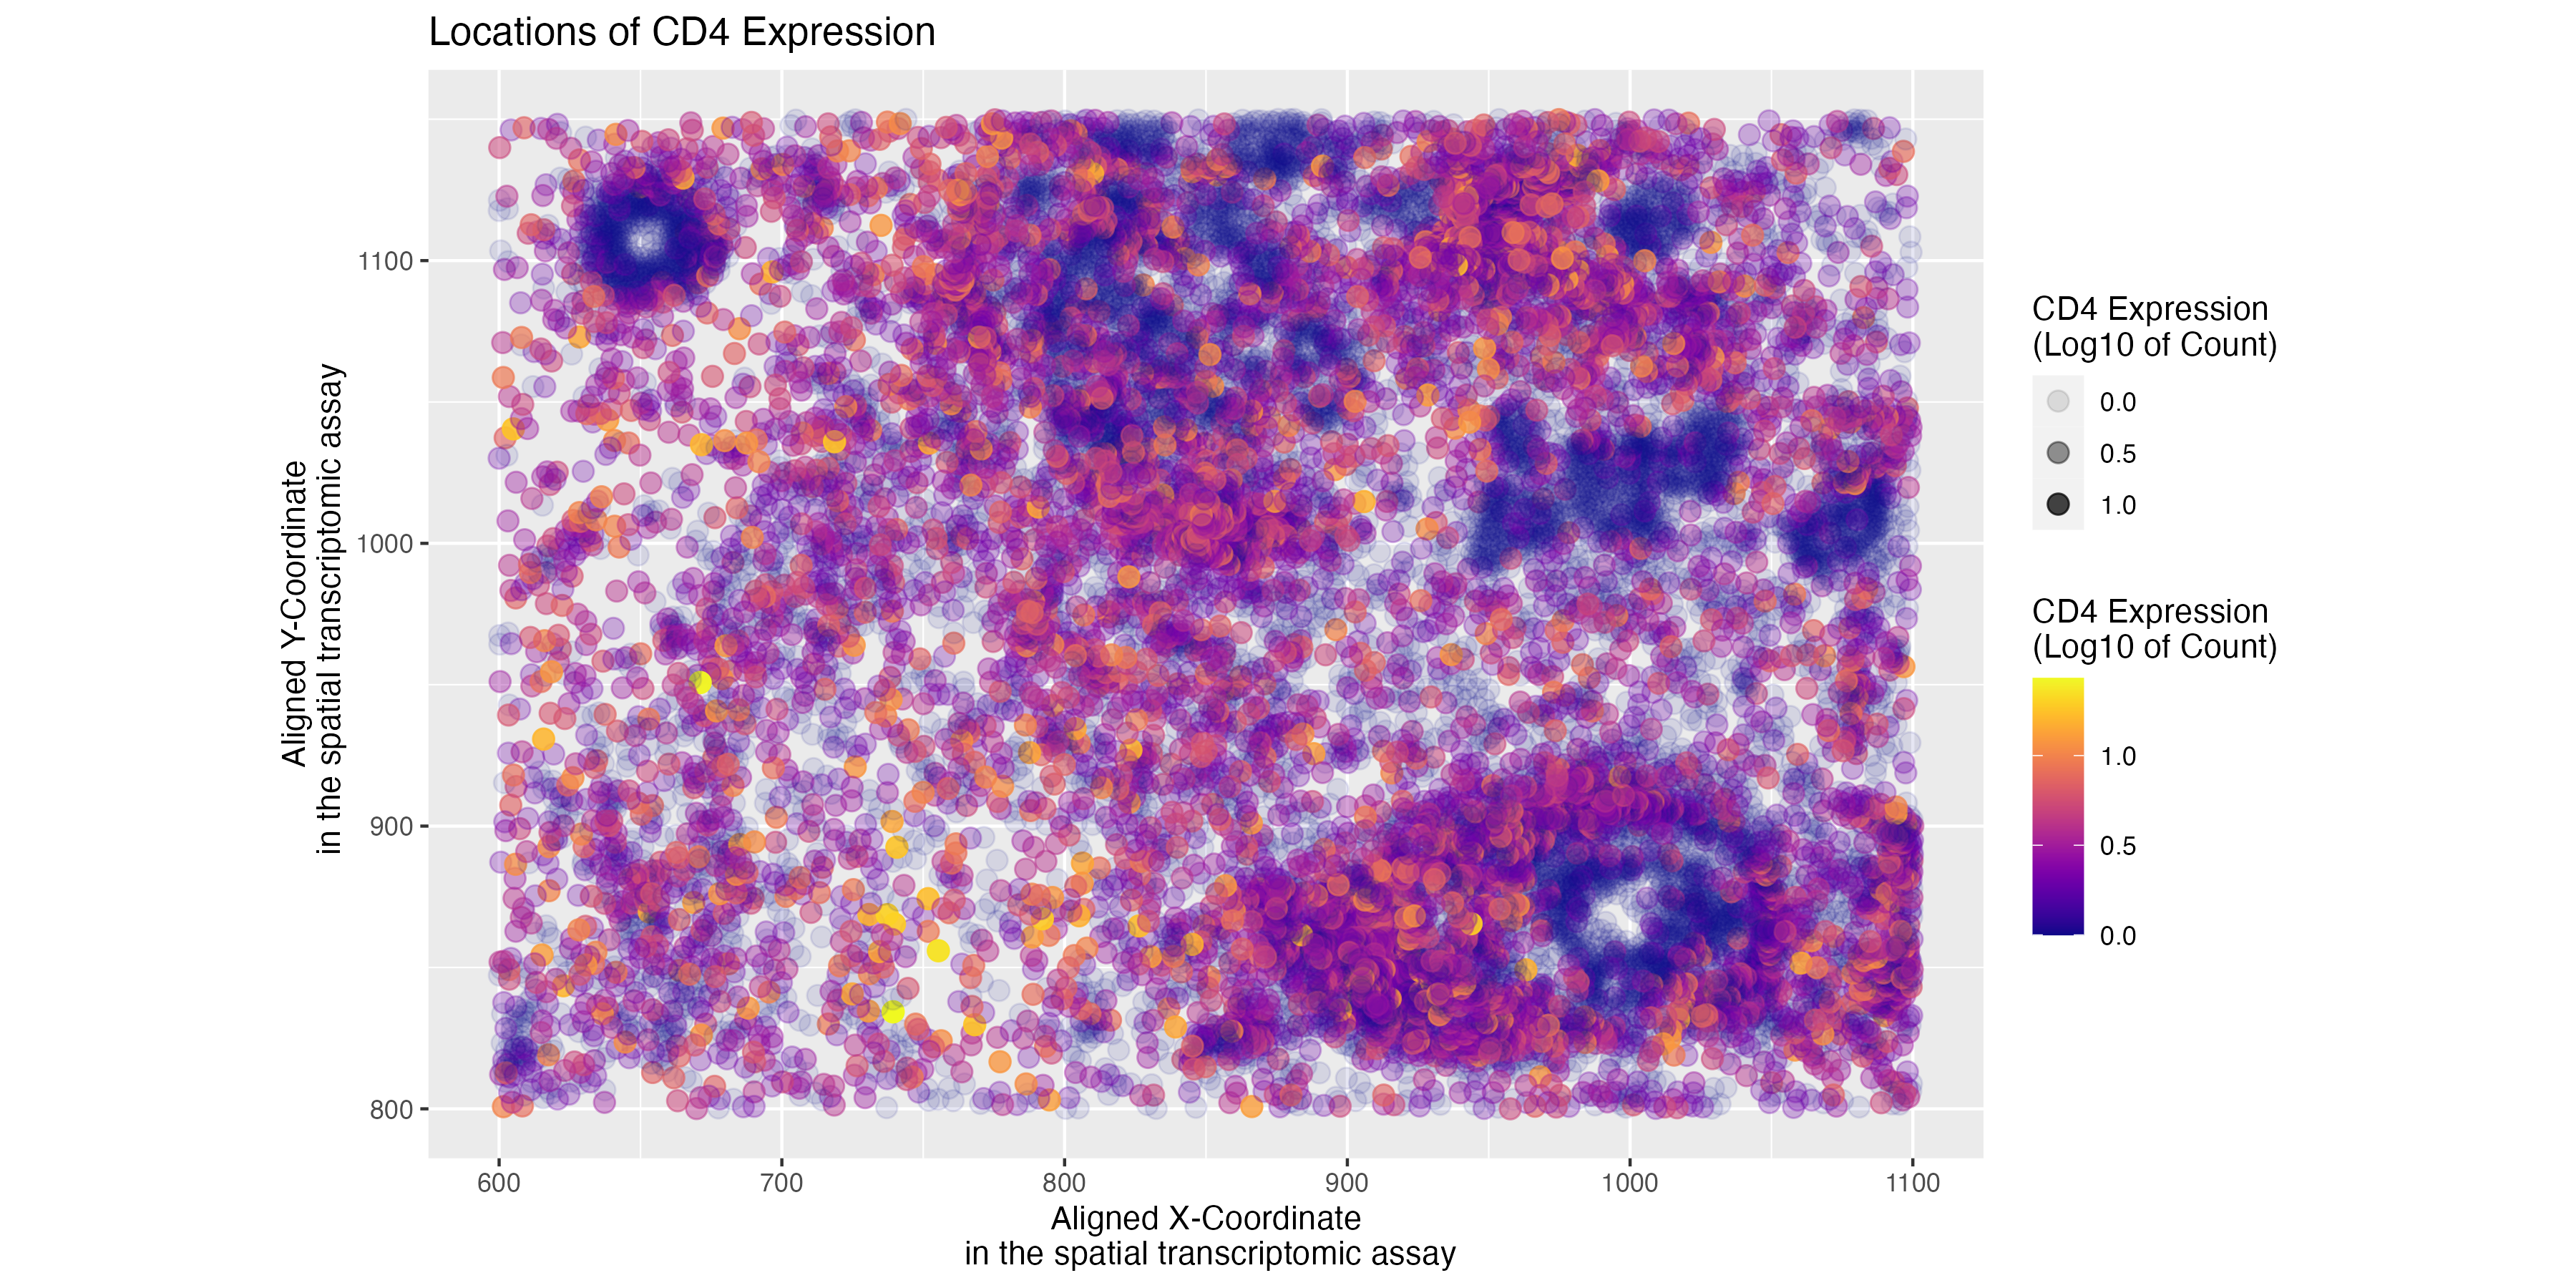
I am applying Esther’s code of visualizing spatial variation in CD4 gene expression to the pikachu dataset.
Critique the resulting visualization when applied to your data.
The resulting visualization fulfils the original objective of showing the spatial variation in the expression of the CD4 genes.
Do you think the author was effective in making salient the point they said they wanted to make?
Yes, the initial visualization emphasizes areas of high versus low CD4 expression. The author’s choice to add transparency in addition to saturation helps emphasize the spatial patterns of high versus low CD4 expression.
How could you improve the data visualization in making salient the point they said they wanted to make?If you don’t think the data visualization can be improved, explain why the data visualization is already effective
While the visualization helps differentiate high versus low CD4 expression,the very low transparency makes it hard to visualize the areas of low expression, especially when the code is adapted for the smFISH dataset. Scaling up the transparency may help improve the saliency of the visualization.
library(dplyr)
library(tidyverse)

## Set working directory path and read in data
setwd("/Users/archanabalan/Karchin Lab Dropbox/Archana Balan/Coursework/Spring2024/GDV/homework/")
data <- read.csv("./data/pikachu.csv.gz", row.names =1)

# Plot using code as adapted from Esther's HW1 submission
library(ggplot2)
library(viridis)
plot_CD4 <- ggplot(data) +
            geom_point(aes(x=aligned_x, y=aligned_y,col = log10(CD4+1), alpha = log10(CD4+1)), size=3,
shape=19) +
            scale_color_viridis(option="plasma")
hw2.plt = plot_CD4 +
          ggtitle("Locations of CB4 Expression")  +
           coord_fixed() +
           labs(x="Aligned X-Coordinate\n in the spatial transcriptomic assay", y="Aligned
Y-Coordinate\n in the spatial transcriptomic assay", color="CD4 Expression\n(Log10 of Count)",
alpha="CD4 Expression\n(Log10 of Count)")


ggsave("./hw2/hw2_abalan2.png", hw2.plt, width = 12, height = 6, units = "in")