Spatial Localization of Cells for Total Number of Distinct Genes Expressed

Whose code are you applying?
Jonathan Wang (jwang428)
Do you think the author was effect in making salient the point they said they wanted to make?
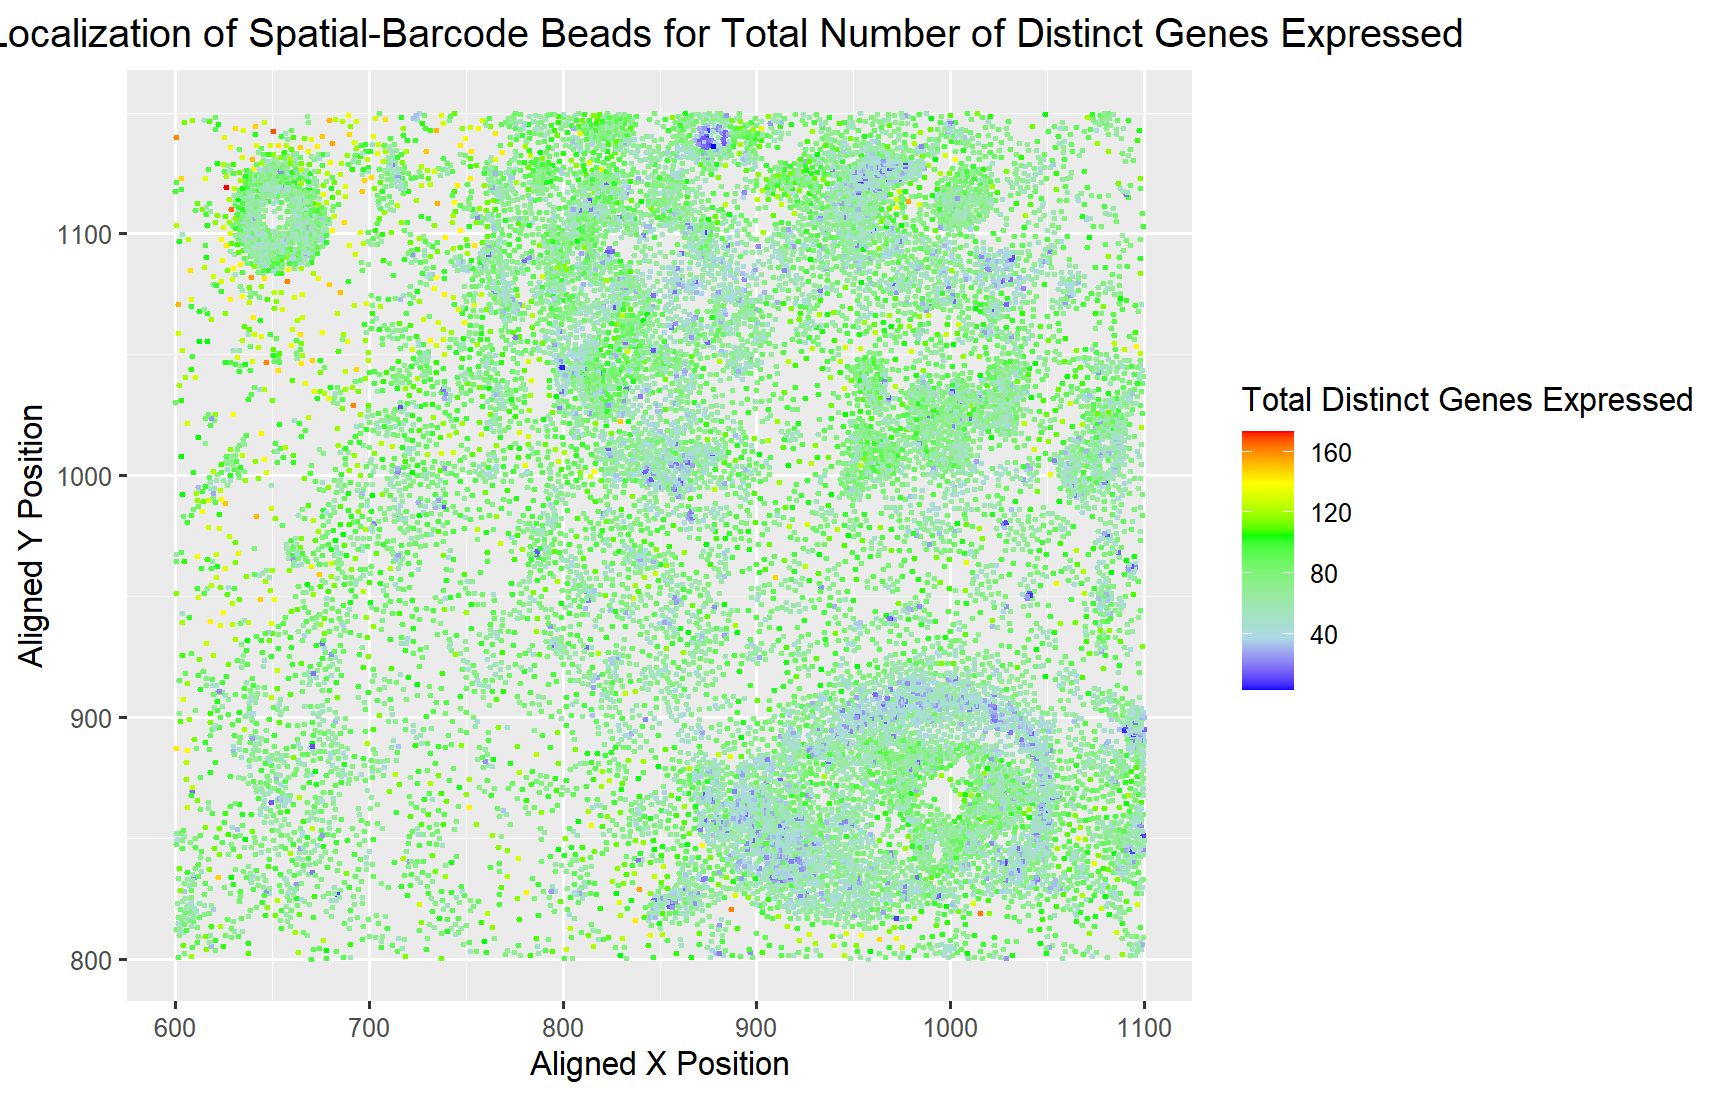
Yes, I believe the author was effective in making salient the point they wanted to make which was how the gene expression is diversed across the spatial locations. It can be seen in the plot that there are distinct areas of cells with very low diversity, only expression of a few distinct genes. While most of the areas have an average of 120 genes being expressed at the same time. Sparsely, throughout the sample there are a few cells with abnormally high diversity of genes at around 160 distinct genes.
How could you improve the data visualization in making salient the point they said they wanted to make? If you don’t think the data visualization can be improved, explain why the data visualization is already effective.
I believe to make their point more salient, they could have used color saturation instead of color hues which is higher up on the encoding scale. In addition, if we could use another visual channel, I would probably use the size of the circles (area) to indicate the total distinct gene expression. Area is an even better encoder than color for quantitative data types like the number of distinct genes, which can make the point even more salient.
data <- read.csv('pikachu.csv.gz', row.names = 1)
dim(data)
colnames(data)

data[1:10, 1:10]

## utilizing another student's data visualization technique on my data (jwang428)
# Initialization of variables
x_pos <- data[,4]
y_pos <- data[,5]
gen_exp <- data[,6:ncol(data)]
colnames(gen_exp)

# Determine total # of genes expressed by each barcode
gen_exp_count <- rowSums(gen_exp != 0)
total_genes_exp = as.numeric(gen_exp_count)

# making the data visualization
library(ggplot2)
p <- ggplot(data) +
  geom_point(aes(x = x_pos, y = y_pos, col = total_genes_exp), size = 0.5) +
  xlab("Aligned X Position") + ylab("Aligned Y Position") + ggtitle("Spatial Localization of Cells for Total Number of Distinct Genes Expressed") +
  scale_colour_gradientn(colors = c("blue", "lightblue", "lightgreen", "green", "yellow", "red")) + theme(plot.title = element_text(hjust = 0.5))

p + theme(legend.title.align=0.5) + labs(color="Total Distinct Genes Expressed")