Learning from classmates - Visualizing Locations of Different Gene Expressions
Whose code are you applying?
Connie C (cchen260)
Do you think the author was effective in making salient the point they said they wanted to make?
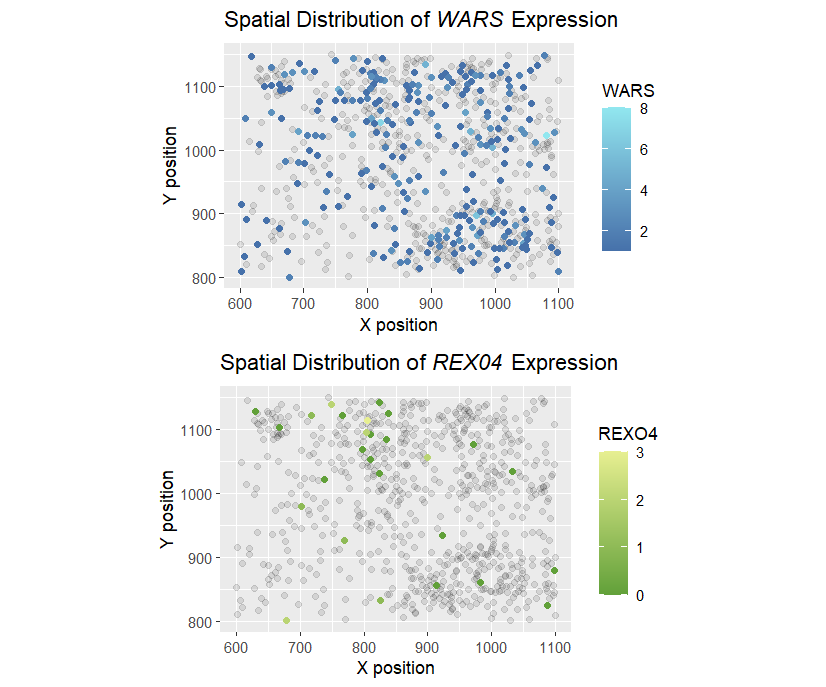
My classmate was to make salient the spots with cells that express WRN and RECQL4 and to what extent compared to other spots. I think the visualization worked fine for the original dataset my classmate was using, since the x and y positions are more on the discrete ends so that points don’t overlap with each other. The visualization seems self-evident in expressing the spatial information. However, the color gradient used is slightly disturbing as it does not distinguish well between no expression and one expression (which means different things). I would like to change the color gradient and make the non-expressing cells transparent for better contrast. In addition, since my classmate is not trying to make saliant the correlation between WRN and RECQL4, two separate plots with the same encoding should be used instead of two different encodings on a single plot.
#adapted to data from Connie C
setwd("C:/Users/Qingyu/OneDrive - Johns Hopkins/Classes/Data Visualization/HW2")
data <- read.csv('pikachu.csv.gz', row.names = 1)
dim(data)
data[1:10,1:10]
colnames(data)

#resample the pikachu dataset to 708 spots for matching the orginal plot
data_sub <- data[seq(1, 17136, by = 24),1:ncol(data)]
data_WARS <- data_sub[which(data_sub$WARS > 0),]
data_REXO4 <- data_sub[which(data_sub$REXO4 > 0),]
data_WARS_n <- data_sub[which(data_sub$WARS < 1),]
data_REXO4_n <- data_sub[which(data_sub$REXO4 < 1),]


#WRN$RECQL is not present in this dataset, so changed to WARS and REXO4
library(ggplot2)

plot_WARS<-ggplot() +
    geom_point(data=data_WARS_n,aes(x = aligned_x,y = aligned_y,alpha=0.2))+
    geom_point(data=data_WARS,aes(x = aligned_x,y = aligned_y,col=WARS,alpha=1))+
    scale_colour_gradient2(low = "gray20",mid= "#3961a0",high = "#91e7ef",space = "Lab")+
    guides(size ='none', alpha = 'none') +
    coord_fixed() +
    labs(title = expression(paste("Spatial Distribution of ", italic("WARS"), " Expression")),
       x = "X position",
       y = "Y position",
       color = "WARS")

plot_REX04<-ggplot() +
  geom_point(data=data_REXO4_n,aes(x = aligned_x,y = aligned_y,alpha=0.2))+
  geom_point(data=data_REXO4,aes(x = aligned_x,y = aligned_y, col=WARS,alpha=1))+
  scale_colour_gradient2(low = "gray20",mid= "#61a039",high = "#e7ef91",space = "Lab")+
  guides(size ='none', alpha = 'none') +
  coord_fixed() +
  labs(title = expression(paste("Spatial Distribution of ", italic("REX04"), " Expression")),
       x = "X position",
       y = "Y position",
       color = "REXO4")

#install.packages("gridExtra")
require(gridExtra)
grid.arrange(plot_WARS, plot_REX04, ncol=1)