Spatial Locations of CD4 Expression

-
Whose code are you applying? Provide a JHED
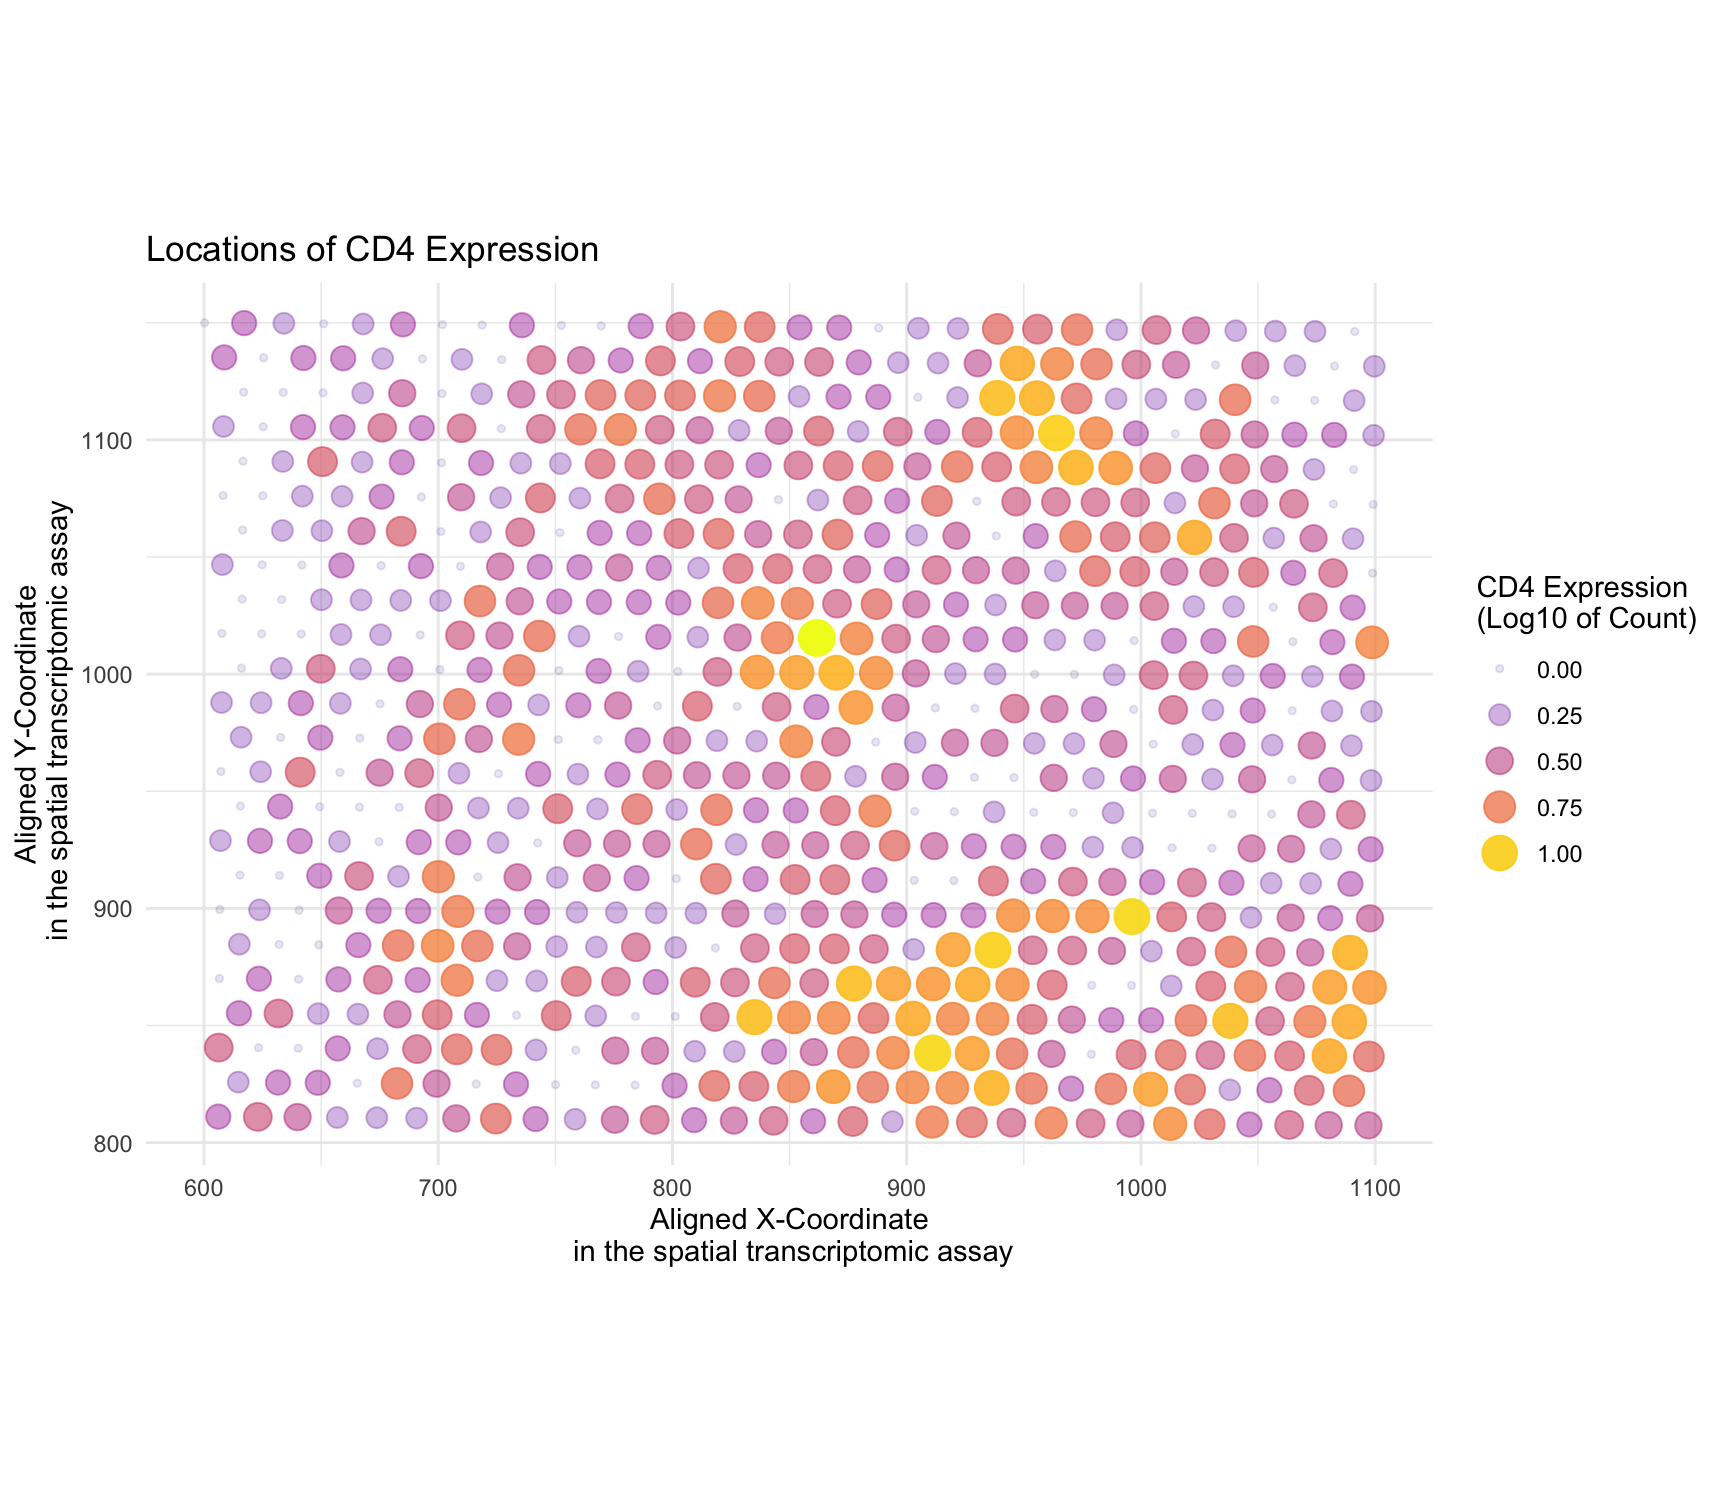
I am applying code by ewhang. The author visualized the eevee dataset. Their goal was to see the specific locations of CD4 gene expression in the tissue. -
Critique the resulting visualization when applied to your data. Do you think the author was effective in making salient the point they said they wanted to make?
The author was able to make the salient point clearly. They said they were visualizing the CD4 gene expression count and the location of its expression. I like the use of transparency, variation in hue and saturation in highlighting the specific areas with CD4 expression in the scatter plot. The Gestalt principle used was similarity as CD4 expression share two similar elements (hue and transparency) that make them visually more similar. The visual channel and geometric primitive chosen by the author seem to align with their intended goal of making the location of CD4 expression more noticeable in the visualization. However, there was a typo in the figure’s title and the main text for the gene name. -
How could you improve the data visualization in making salient the point they said they wanted to make? If you don’t think the data visualization can be improved, explain why the data visualization is already effective.
-
Improvements in the data visualization:
I adjusted the alpha values for transparency, using a factor of 0.8 multiplied by the log-transformed CD4 expression count. This modification refines the transparency effect, making areas with higher CD4 expression more distinguishable while maintaining the overall aesthetic balance. I included of the size aesthetic in the geom_point() layer for the representation of CD4 expression through point size, providing an additional visual channel to the spatial distribution. I combined the color saturation, transparency and size legends into a single panel, offering a more cohesive and streamlined presentation of the CD4 expression information. I have also added the theme to
theme_minimal()which contributes to a cleaner and more focused presentation, and emphasizing the spatial distribution of CD4 expression. I also corrected the typo in the title. -
Improvements in making the Salient Point:
The salient point the author aims to emphasize is the specific locations of CD4 expression. The adjustment in alpha values contributes to a more nuanced transparency effect, allowing viewers to better discern the spatial patterns of CD4 expression. Including the size aesthetic provides an additional visual channel, making it easier for viewers to perceive and differentiate the levels of CD4 expression at different spatial locations. By mapping transparency, color and size to the same log-transformed CD4 expression count legend, I am trying to establish a consistent relationship between these aesthetics and visual channels. This integration allows viewers to interpret CD4 expression information in a easier way, reinforcing the understanding of magnitude of expression levels at specific locations in the spatial transcriptomic assay. For example- bigger, higher saturation, and opaque dots correspond to higher expression.
-
Code
#libraries
library(ggplot2)
library(viridis)

#data
data <- read.csv('/Users/nidhisoley/Desktop/GDataViz/eevee.csv.gz', row.names = 1)

#ggplot
plot_CD4 <- ggplot(data) +
  geom_point(aes(x = aligned_x, y = aligned_y, col = 0.8*log10(CD4 + 1), alpha = 0.8 * log10(CD4 + 1), size = 0.8*log10(CD4 + 1)), shape = 19) +
  scale_color_viridis(option="plasma") +
  guides(
    color = guide_legend(title = "CD4 Expression\n(Log10 of Count)"),
    alpha = guide_legend(title = "CD4 Expression\n(Log10 of Count)"),
    size = guide_legend(title = "CD4 Expression\n(Log10 of Count)")
  )

plot_CD4 +
  ggtitle("Locations of CD4 Expression") +
  coord_fixed() +
  labs(x = "Aligned X-Coordinate\n in the spatial transcriptomic assay",
       y = "Aligned Y-Coordinate\n in the spatial transcriptomic assay") +
  theme_minimal()