The highest expression of the top 10 highly expressed genes

What data types are you visualizing?
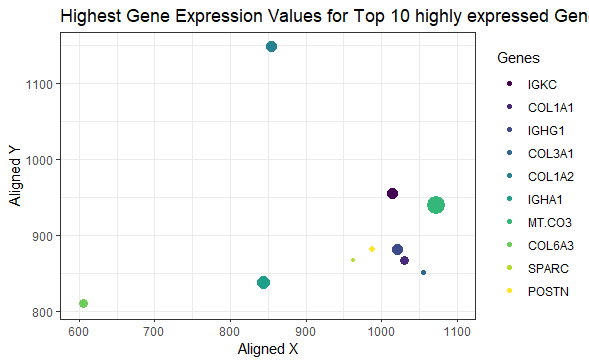
I am visualizing quantitative data of the expression count of the top 10 highly expressed genes in the eevee dataset, quantitative data of the spatial coordinates for the highest gene expression, and categorical data regarding the top 10 genes.
What data encodings are you using to visualize these data types?
I am using the geometric primitive of points to represent expression count for each gene. To encode expression count of the top 10 genes, I am using the visual channel of size of the points. To encode the spatial coordinates for the highest expression, I am using the visual channel of position along the x and y axis respectively. To encode the category of the genes expressed, I am using the visual channel of color.
What type of data visualization is this? What about the data are you trying to make salient through this data visualization? What Gestalt principles have you applied towards achieving this goal if any?
My explanatory data visualization seeks to make more salient the visualization of the location and expression of the highest gene expressions from the eevee dataset.
Please share the code you used to reproduce this data visualization.
#HW1
library(dplyr)
library(viridis)
library(ggplot2)

dataeevee <- read.csv('C:/Users/Kaashvi Pruthi/Downloads/Genomic data visualization/eevee.csv.gz', row.names = 1)
# Top 10 genes expressed in eevee
top_genes <- names(sort(colMeans(dataeevee[, -c(1, 2, 3)]), decreasing = TRUE)[1:10])
# Create empty plot with labels and theme
plot <- ggplot(dataeevee) +
  theme_bw() +
  labs(title = "Highest Gene Expression Values for Top 10 highly expressed Genes",
       x = "Aligned X", y = "Aligned Y")

# Define a color palette for the genes
gene_colors <- viridis_pal()(length(top_genes))

point_data <- data.frame()  # Initialize empty data frame

# Loop through each gene and add point data
for (i in seq_along(top_genes)) {
  gene <- top_genes[i]

  # Find and select the highest expression point
  max_idx <- which.max(dataeevee[[gene]])
  max_value <- dataeevee[[gene]][max_idx]

  # Check if max_idx is valid and there are no missing values
  if (length(max_idx) > 0 && !any(is.na(dataeevee[max_idx, c("aligned_x", "aligned_y")]))) {
    max_point <- dataeevee[max_idx, c("aligned_x", "aligned_y")]

    point_data <- rbind(point_data, data.frame(aligned_x = max_point$aligned_x, aligned_y = max_point$aligned_y, gene = gene, value = max_value))
  } else {
    print(paste("No valid index found or missing values for gene:", gene))
  }
}

# After the loop
plot <- plot +
  geom_point(data = point_data, aes(x = aligned_x, y = aligned_y, color = gene, size = value)) +
  guides(size = FALSE) +
  scale_color_manual(name = "Genes",
                     values = gene_colors,
                     labels = top_genes) +
  coord_cartesian(ylim = range(dataeevee$aligned_y, na.rm = TRUE),
                  xlim = range(dataeevee$aligned_x, na.rm = TRUE))

# Print or save the plot
print(plot)
print(point_data)