Locations of CB4 Expression

What data types are you visualizing?
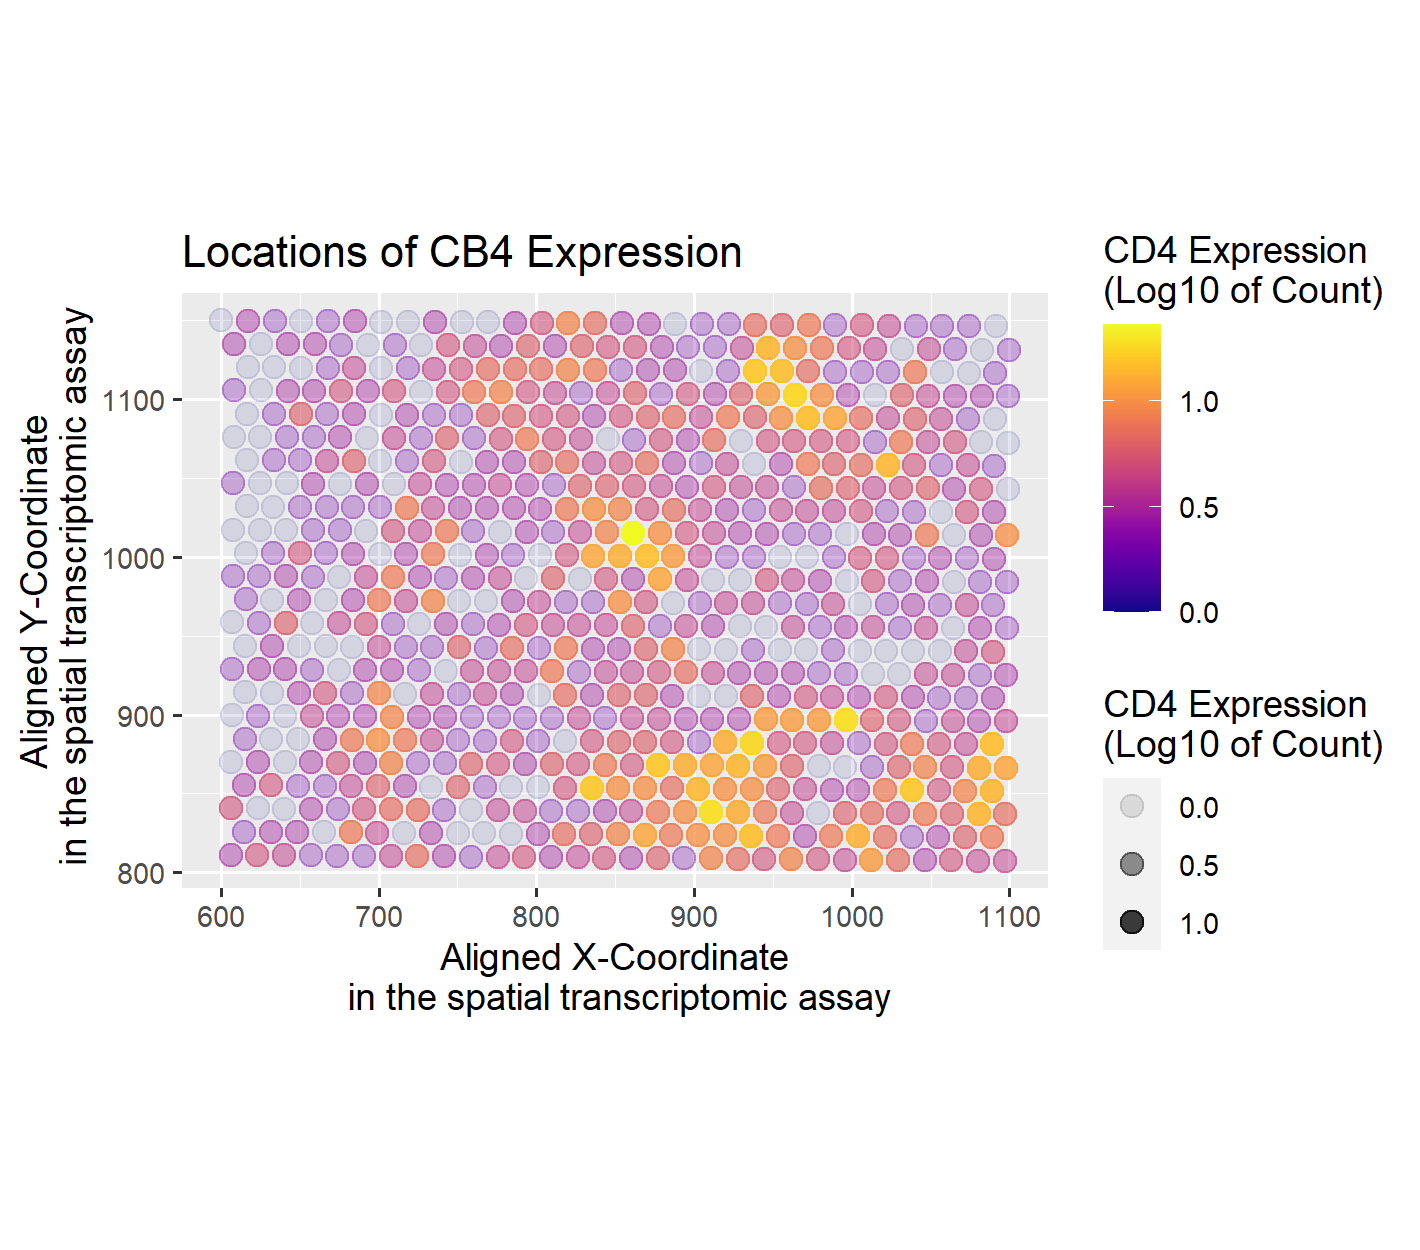
I am visualizing CB4 gene expression count (quantitative data) and location of its expression (spatial data).
What data encodings are you using to visualize these data types?
For geometric primitives, I am using points to represent each bead of microdissection. I encode the spatial x and y position of each bead with the visual channel of position, placing each point at corresponding location along the x and y axis. I encode the gene expression count with the visual channel of color, varying the color both in saturation and hue. The specific color scale is done by taking the log10 of the expression count which allows a better representation of the range of expression count. The color scale goes from almost transparent dark blue for no expression to a fully saturated yellow for the highest expression count value.
What type of data visualization is this? What about the data are you trying to make salient through this data visualization? What Gestalt principles have you applied towards achieving this goal if any?
This data visualization is most similar to a scatter plot. The point I seek to make more salient is the specific locations of CB4 expression, making it easier to find where there is CB4 expression. One choice that helped emphasize the locations of gene expression is varying the transparency of each cell depending on the gene expression count. The effect of varying the transparency was similar to varying the saturation. This made the bright saturated areas with CB4 expression stand out, while the the non-CB4 beads faded from focus. By varying both the hue and saturation, I was able to effectively apply the Gestalt principle of similarity, as the beads with CB4 expression now have two different elements that made them more similar to each other over the beads without CB4 expression.
Please share the code you used to reproduce this data visualization.
data <- read.csv('C:\\Users\\emw\\OneDrive - Johns Hopkins\\spring 2024\\genomic-data-visualization-2024\\data\\eevee.csv.gz', row.names=1)
library(ggplot2)
library(viridis)
plot_CD4 <- ggplot(data) + geom_point(aes(x=aligned_x, y=aligned_y,col = log10(CD4+1), alpha = log10(CD4+1)), size=3, shape=19) + scale_color_viridis(option="plasma")
plot_CD4 + ggtitle("Locations of CB4 Expression")  +  coord_fixed() +
  labs(x="Aligned X-Coordinate\n in the spatial transcriptomic assay", y="Aligned Y-Coordinate\n in the spatial transcriptomic assay", color="CD4 Expression\n(Log10 of Count)", alpha="CD4 Expression\n(Log10 of Count)")