Expression of WRN and RECQL4 versus x and y position in Spacial-barcode bead capture

What data types are you visualizing?
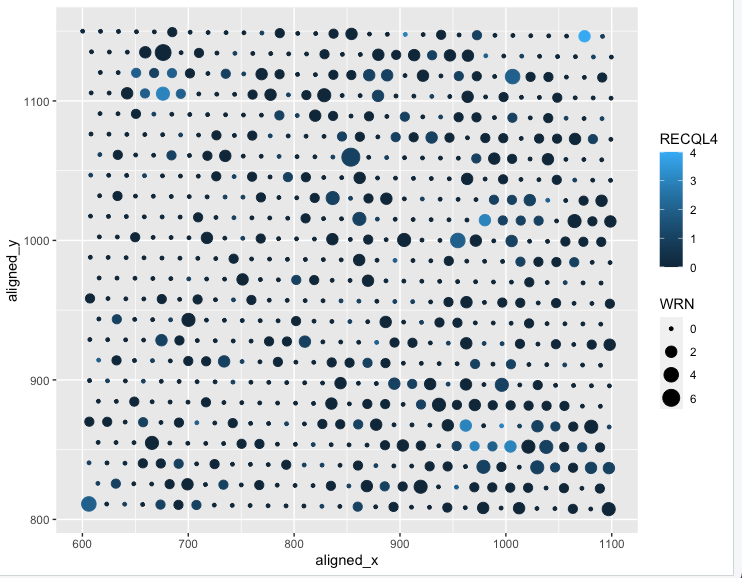
I am visualizing quantitative data of the expression count of the WRN gene for each spot, quantitative data of expression count of the RECQL4 gene for each spot, and spatial data regarding the aligned x and y values for each spot.
What data encodings are you using to visualize these data types?
I am using the geometric primitive of points to represent each spot. To encode expression count of the WRN gene, I am using the visual channel of size as given by the legend on the right of the graph. To encode the expression count for RECQL4 for each spot, I am using the visual channel of color saturation going from very unsaturated dark blue, to a light blue. To encode the aligned x position, I am using the visual channel of position along the x axis. To encode the aligned y position, I am using the visual channel of position along the y axis.
What type of data visualization is this? What about the data are you trying to make salient through this data visualization? What Gestalt principles have you applied towards achieving this goal if any?
WRN and RECQL4 are both important genes in the development of osteosarcoma. Through this data visualization, I’m trying to make salient the spots with cells that express WRN and RECQL4 and to what extent compared to other spots. A Gestalt principle I applied is the principle of similarity as you can group the spots by color and size. The ligher blue spots represent spots with higher expression of RECQL4 and the larger spots represent higher expression of WRN.
Please share the code you used to reproduce this data visualization.
data <- read.csv('eevee.csv.gz', row.names = 1)
dim(data)
data[1:10,1:10]
colnames(data)

#18085 genes and 708 spots

install.packages('ggplot2')
library(ggplot2)


ggplot(data) +
  geom_point(aes(x = aligned_x,y = aligned_y, size = WRN, col = RECQL4))