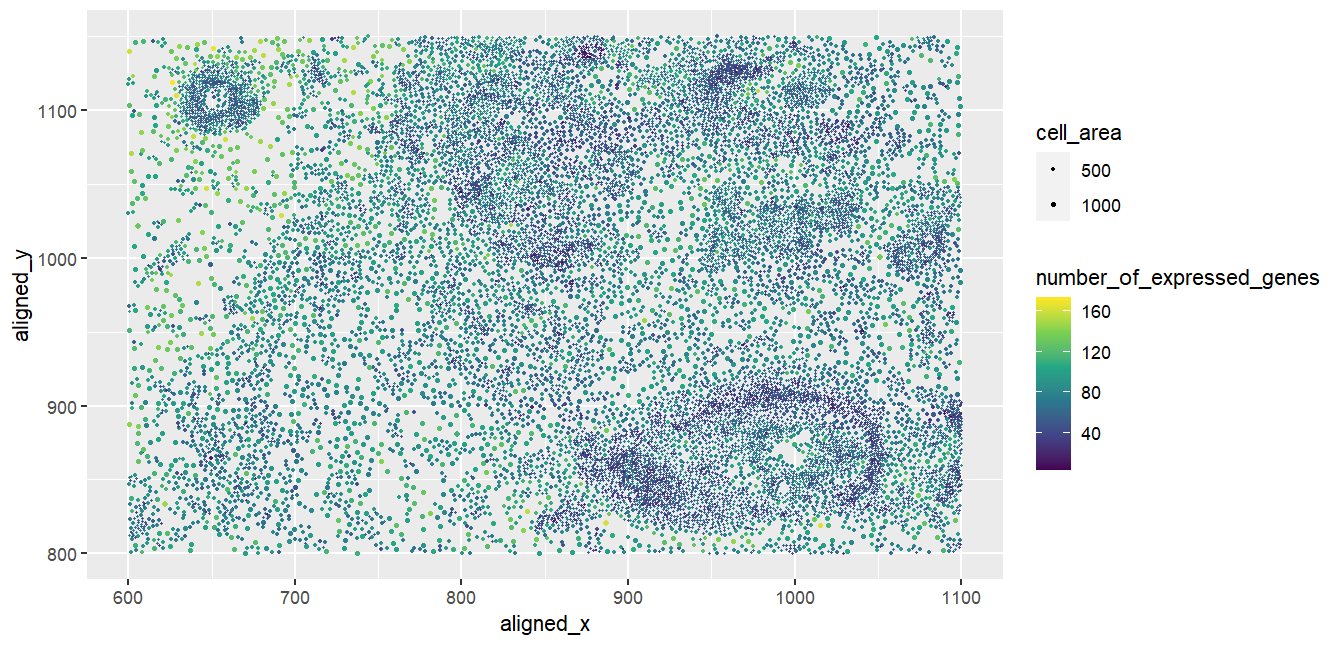
Spatial visualization of number of genes expressed by cells of varying sizes

What data types are you visualizing?
I am visualizing three types of quantitative data: firstly, the spatial locations of each cell given by their (x,y) Cartesian coordinates; secondly, the area of the cell given as a decimal; thirdly, the number of distinct genes expressed in each cell, given as an integer. We count the number of distinct genes by iterating through the data and counting the number of non-zero entries across all genes for each cell.
What data encodings (geometric primitives and visual channels) are you using to visualize these data types?
The representation of each cell is encoded by the geometric primitive of a point. To visualize the spatial locations, we use the visual channel of position to encode the (x,y) coordinates of each cell. To visualize the area of the cell, we use the visual channel of size to encode the cell area. Finally, to visualize the number of genes expressed in each cell, we use the visual channel of colour, ranging from dark blue to bright yellow as the number of genes expressed by the cell increases.
What about the data are you trying to make salient through this data visualization?
Through expressing both the cell area and the number of genes expressed by the cells along with an intuitive encoding of the spatial locations of the cells, my visualization makes two relationships more salient: the relationship between cell location and cell size, as well as the relationship between cell location and number of genes expressed.
What Gestalt principles or knowledge about perceptiveness of visual encodings are you using to accomplish this?
In this visualization, I applied the Gestalt principle of similarity with respect to both size and colour. Points with similar sizes are used to encode cells with similar area, and points with similar colours are used to encode cells with similar numbers of distinct genes expressed. Furthermore, I applied the Gestalt principle of proximity, as cells that are nearer to each other spatially are represented as points that are closer to each other in the visualization; furthermore, the legend is located away from the data to avoid the legend being visualized as part of the data.
data <- read.csv('pikachu.csv.gz', row.names = 1)
dim(data)
data[1:10,1:10]
data[1,1]
colnames(data)
library(ggplot2)
library(ggforce)
gene_number <- integer(17136)
print(gene_number)
gene_number
for (i in 1:10) {
  for (j in 6:10)  {
    print(data[i,j])
  }
}
for (i in 1:17136) {
  for (j in 6:318){
    if (data[i,j]!=0) {
      gene_number[i] <- gene_number[i]+1
    }
  }
}
print(gene_number)
ggplot(data)+ geom_point(aes(x=aligned_x, y=aligned_y, size = cell_area, col=gene_number)) + scale_size_continuous(range = c(1/10,1)) + scale_color_continuous(type = "viridis")