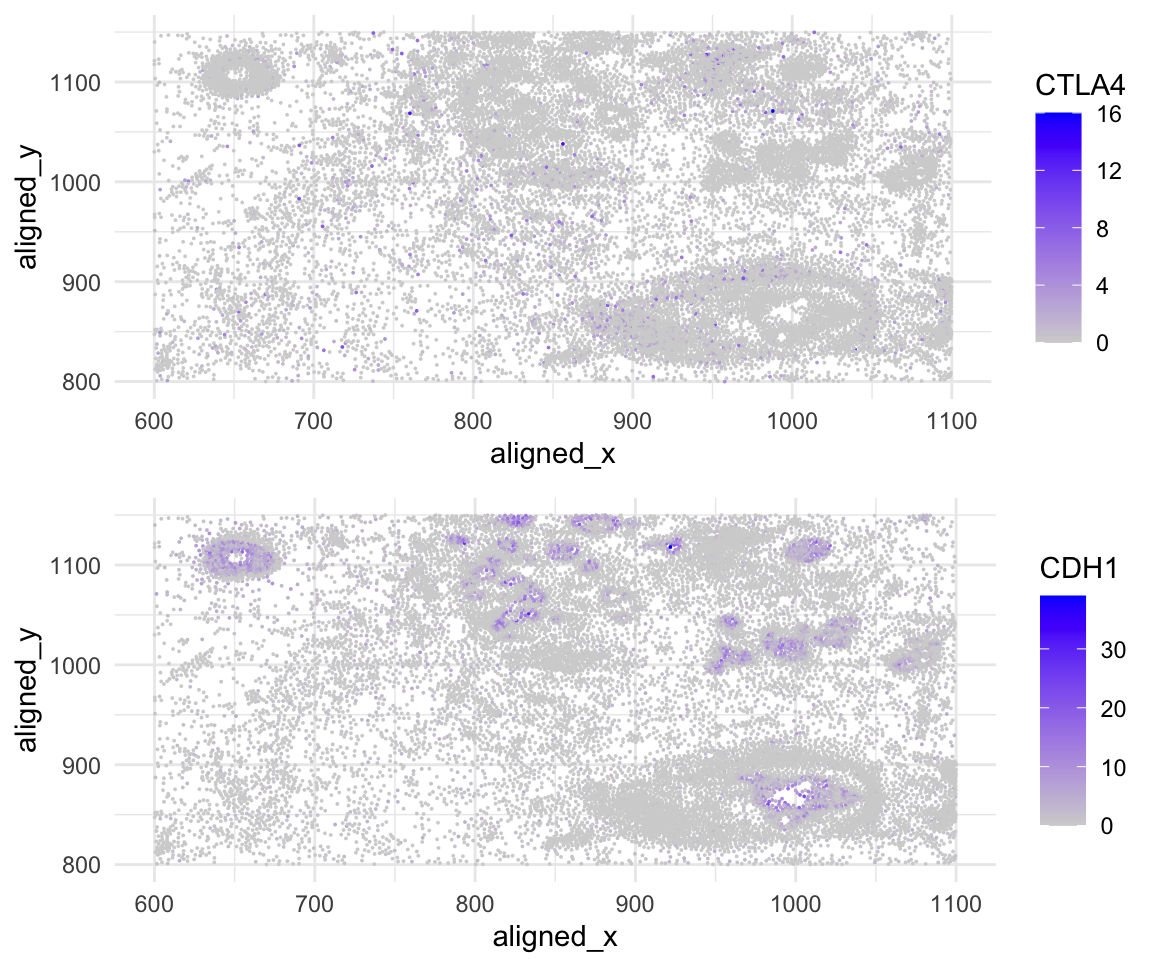
Spacial gene expression of CTLA4 and CDH1

What data types are you visualizing?
I am encoding spatial data because you can see the genes being expressed in the cell via the x,y alignment. I am also encoding quantitive data by the scale of how many cells are expressing the genes.
What data encodings (geometric primitives and visual channels) are you using to visualize these data types?
I am using the geometric primitive of points to represent each cell. To encode the expression count of the CTLA4 and CDH1 gene, I am using the visual channel of color hue and saturation, going from an unsaturated light grey to a saturated purple. To encode the spatial x position, I am using the visual channel of position along the x-axis. To encode the spatial y position, I am using the visual channel of position along the y-axis.
What about the data are you trying to make salient through this data visualization?
My data visualization seeks to make more salient the relationship between CTLA4 and CDH1 expression and the cell positions.
What Gestalt principles or knowledge about perceptiveness of visual encodings are you using to accomplish this?
I used the Gestalt principles of similarity, proximity, and enclosure to represent the CTLA4 and CDH1 expression within the cell(s) that are aligned spatially. I encode the Gesalt principle of similarity of like cells expressing CTLA4/CDH1 by being colored purple/a saturation of purple. I encode the Gestalt principle of the proximity of the genes being expressed near one another, meaning the cells can be categorized as potentially cancerous cells. I encode the Gesalt principle of enclosure because you can see outlines of cells and if they express the genes CTLA4/CDH1 or not.
# I used https://www.nationalbreastcancer.org/other-breast-cancer-genes/ to find breast cancer genes within the gene list provided in the data csv
# I used https://stackoverflow.com/questions/1249548/side-by-side-plots-with-ggplot2 for the side by side plots

file <- '~/Desktop/genomic-data-visualization-2024/data/pikachu.csv.gz'
data <- read.csv(file, row.names=1)

library(ggplot2)
install.packages("gridExtra")
library("gridExtra")

p1 <- ggplot(data) + geom_point(aes(x = aligned_x, y = aligned_y, col = CTLA4), size = 0.01)
    + scale_colour_gradient(low = 'lightgrey', high = 'blue') + theme_minimal()
p2 <- ggplot(data) + geom_point(aes(x = aligned_x, y = aligned_y, col = CDH1), size = 0.01)
    + scale_colour_gradient(low = 'lightgrey', high = 'blue') + theme_minimal()
grid.arrange(p1,p2)