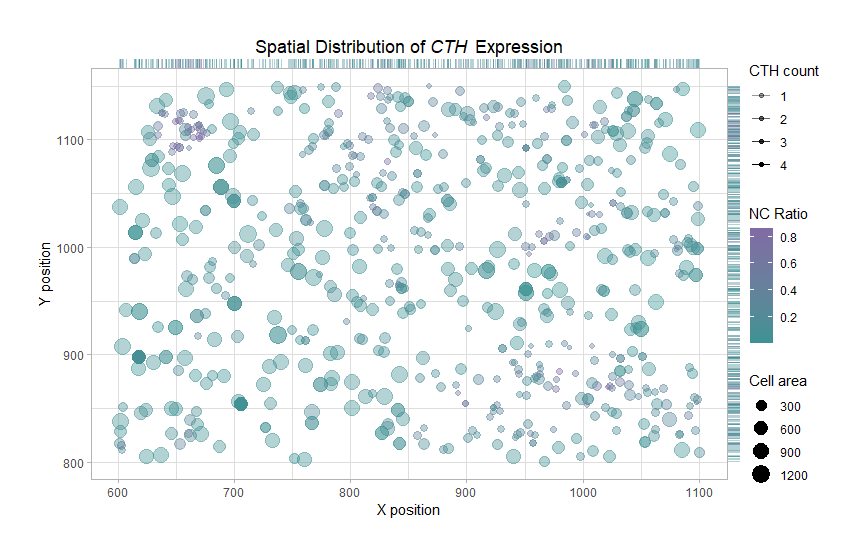
Spatial Distribution of *CTH* Expression
What data types are you visualizing?
In homework1, I am visualizing a subset of the spatially resolved transcriptomic data expressing CTH (pikachu group). The visualization contains quantitaive data of the expression count, area for each cell, the nucleus-to-cytoplasmic (N:C) ratio, and spatial data of aligned 2D centroid positions for the seleted CTH-expressing cells.
What data encodings (geometric primitives and visual channels) are you using to visualize these data types?
Geometric Primitives: Each cell is represented by a point using geom_point() , and projected to the two axis as line segments using geom_rug(). Visual Channels: 2D centroid positions are mapped to x and y positions on the plot. I encoded CTH counts of a single cell (data point) using the visual channel of transparancy. I am using the cisual channel of size to encode the cell area. To encode the N:C ration, I am using the visual channel of color from mature deep turquoise to a more stand-out purple.
What about the data are you trying to make salient through this data visualization?
I am trying to make salient the ETH count of the cells, and the NC ratio (as it is a commonly-used parameter of cell maturing and tumor progression).
What Gestalt principles or knowledge about perceptiveness of visual encodings are you using to accomplish this?
Similarity: Cells with the similar color (green/purple/in-between) represent a similar NC ratio (thus the same growth stage). Interestingly, few cells lie in the middle.
data_full<- read.csv('pikachu.csv.gz',row.names=1)
dim(data_full)

data_full[1:10,1:10]
colnames(data_full)

#calculate the NC ratio
data_full$NC_ratio <- data_full$nucleus_area / data_full$cell_area

#select cells that express CTH
data_CTH <- subset(data_full, CTH >= 1)

#ref: https://www.color-hex.com/color-palette/1022322
xiao_plt <- c("#816BA5","#B091C2", "#496170","#3c9393", "#81c7cf" )

library(ggplot2)
ggplot(data=data_CTH) +
  geom_rug(aes(x = aligned_x, y = aligned_y, alpha = CTH, col = NC_ratio),
           length = unit(0.02, "npc"),outside = TRUE,sides = "tr") +
  coord_cartesian(clip = "off") +
  geom_point(aes(x = aligned_x, y = aligned_y,
                 col = NC_ratio,
                 size = cell_area,alpha=CTH)) +
  #ref: https://ggplot2.tidyverse.org/reference/scale_alpha.html
  scale_alpha(range = c(0.4, 1)) +
  scale_color_gradient(low=xiao_plt[4], high=xiao_plt[1]) +
  #ref: https://www.geeksforgeeks.org/how-to-use-italic-font-in-r/
  labs(title = expression(paste("Spatial Distribution of ", italic("CTH"), " Expression")),
       x = "X position",
       y = "Y position",
       color = "NC Ratio",
       size = "Cell area", alpha = "CTH count")  +
  #ref:https://r-charts.com/ggplot2/themes/
  theme_light() +
  theme(plot.title = element_text(hjust = 0.5),
        plot.margin = margin(1, 1, 1, 1, "cm"))

#plot2 <- ggplot(data=data) +
#  geom_bar(aes(x = cell_id, y = cell_area), stat = "identity", alpha = 0.5, width = 0.5)