Spatial Localization of Spatial-Barcode Beads for Total Number of Distinct Genes Expressed

What data types are you visualizing?
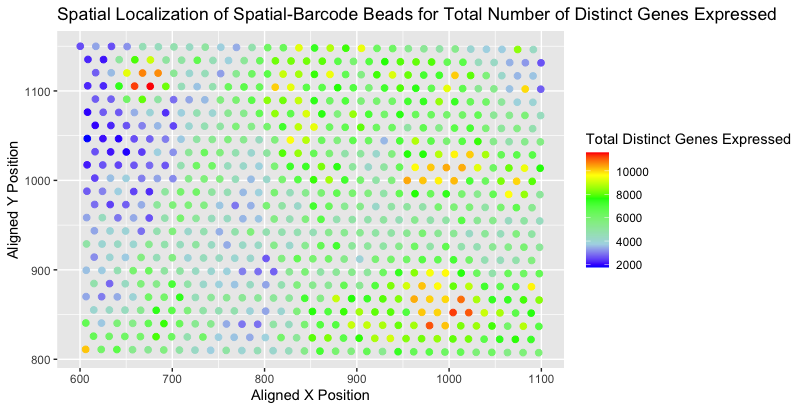
I am visualizing the (1) quantitative data for the total number of distinct genes expressed for each spatial-barcode bead and (2) spatial data for the aligned x,y positions of each spatial-barcode bead. The total number of distinct genes expressed per spatial-barcode bead was calculated by counting the number of genes with associated values > 0 within the provided data (eevee.csv.gz).
What data encodings (geometric primitives and visual channels) are you using to visualize these data types?
I am using the geometric primitive of points to represent each spatial-barcode bead, with the associated aligned x-position and aligned y-position being represented through the visual primitive of position (the aligned x-position varying based on position along the horizontal axis and the aligned y-position varying based on position along the vertical axis). To encode the total number of distinct genes expressed for each spatial-barcode bead, I am using the visual channel of color, specifically hue as lower counts are associated with “blue” and higher counts are associated with “red”.
What about the data are you trying to make salient through this data visualization?
My data visualization seeks to make salient the spatial localization of the diverse amount of gene expression across the sample. More specifically, by encoding the quantitative value of “distinct gene expression” by color, it attempts to elucidate grouped areas of higher genetic expression. One can also note patterns of areas whereby the genetic expression progressively (from “blue” to “green” to “red”) goes from lower to higher.
What Gestalt principles or knowledge about perceptiveness of visual encodings are you using to accomplish this?
As mentioned previously, I specifically looked to utilize the Gestalt principal of similarity regarding the quantitative value of “distinct gene expression”. Spatial-barcode beads with similar genetic expression levels are of the similar color hue: for example, “medium” expression spatial-barcode beads can be visually grouped together based on areas that are colored “green”. I would also like to note that although based on the “ranking of encodings” as outlined by Nils Gehlenborg hue is not ranked highly for encoding quantitative value, I believe it was the best option in this scenario. When using the size of the points to relay the quanitative value, it was actually more confusing to distinguish which points were actually bigger or smaller. The color range of “blue” to “green” to “red” is an easier visual cue.
data <- read.csv('eevee.csv.gz', row.names = 1)

dim(data)
data[1:10, 1:10]
colnames(data)

# Initialization of variables
data <- read.csv('eevee.csv.gz', row.names = 1)

dim(data)
data[1:10, 1:10]
colnames(data)

# Initialization of variables
x_pos <- data[,2]
y_pos <- data[,3]
gen_exp <- data[,4:ncol(data)]
colnames(gen_exp)

# Determine total # of genes expressed by each barcode
gen_exp_count <- rowSums(gen_exp != 0)
total_genes_exp = as.numeric(gen_exp_count)

# making the data visualization
library(ggplot2)
p <- ggplot(data) +
  geom_point(aes(x = x_pos, y = y_pos, col = total_genes_exp), size = 2) +
  xlab("Aligned X Position") + ylab("Aligned Y Position") + ggtitle("Spatial Localization of Spatial-Barcode Beads for Total Number of Distinct Genes Expressed") +
  scale_colour_gradientn(colors = c("blue", "lightblue", "lightgreen", "green", "yellow", "red")) + theme(plot.title = element_text(hjust = 0.5))

p + theme(legend.title.align=0.5) + labs(color="Total Distinct Genes Expressed")