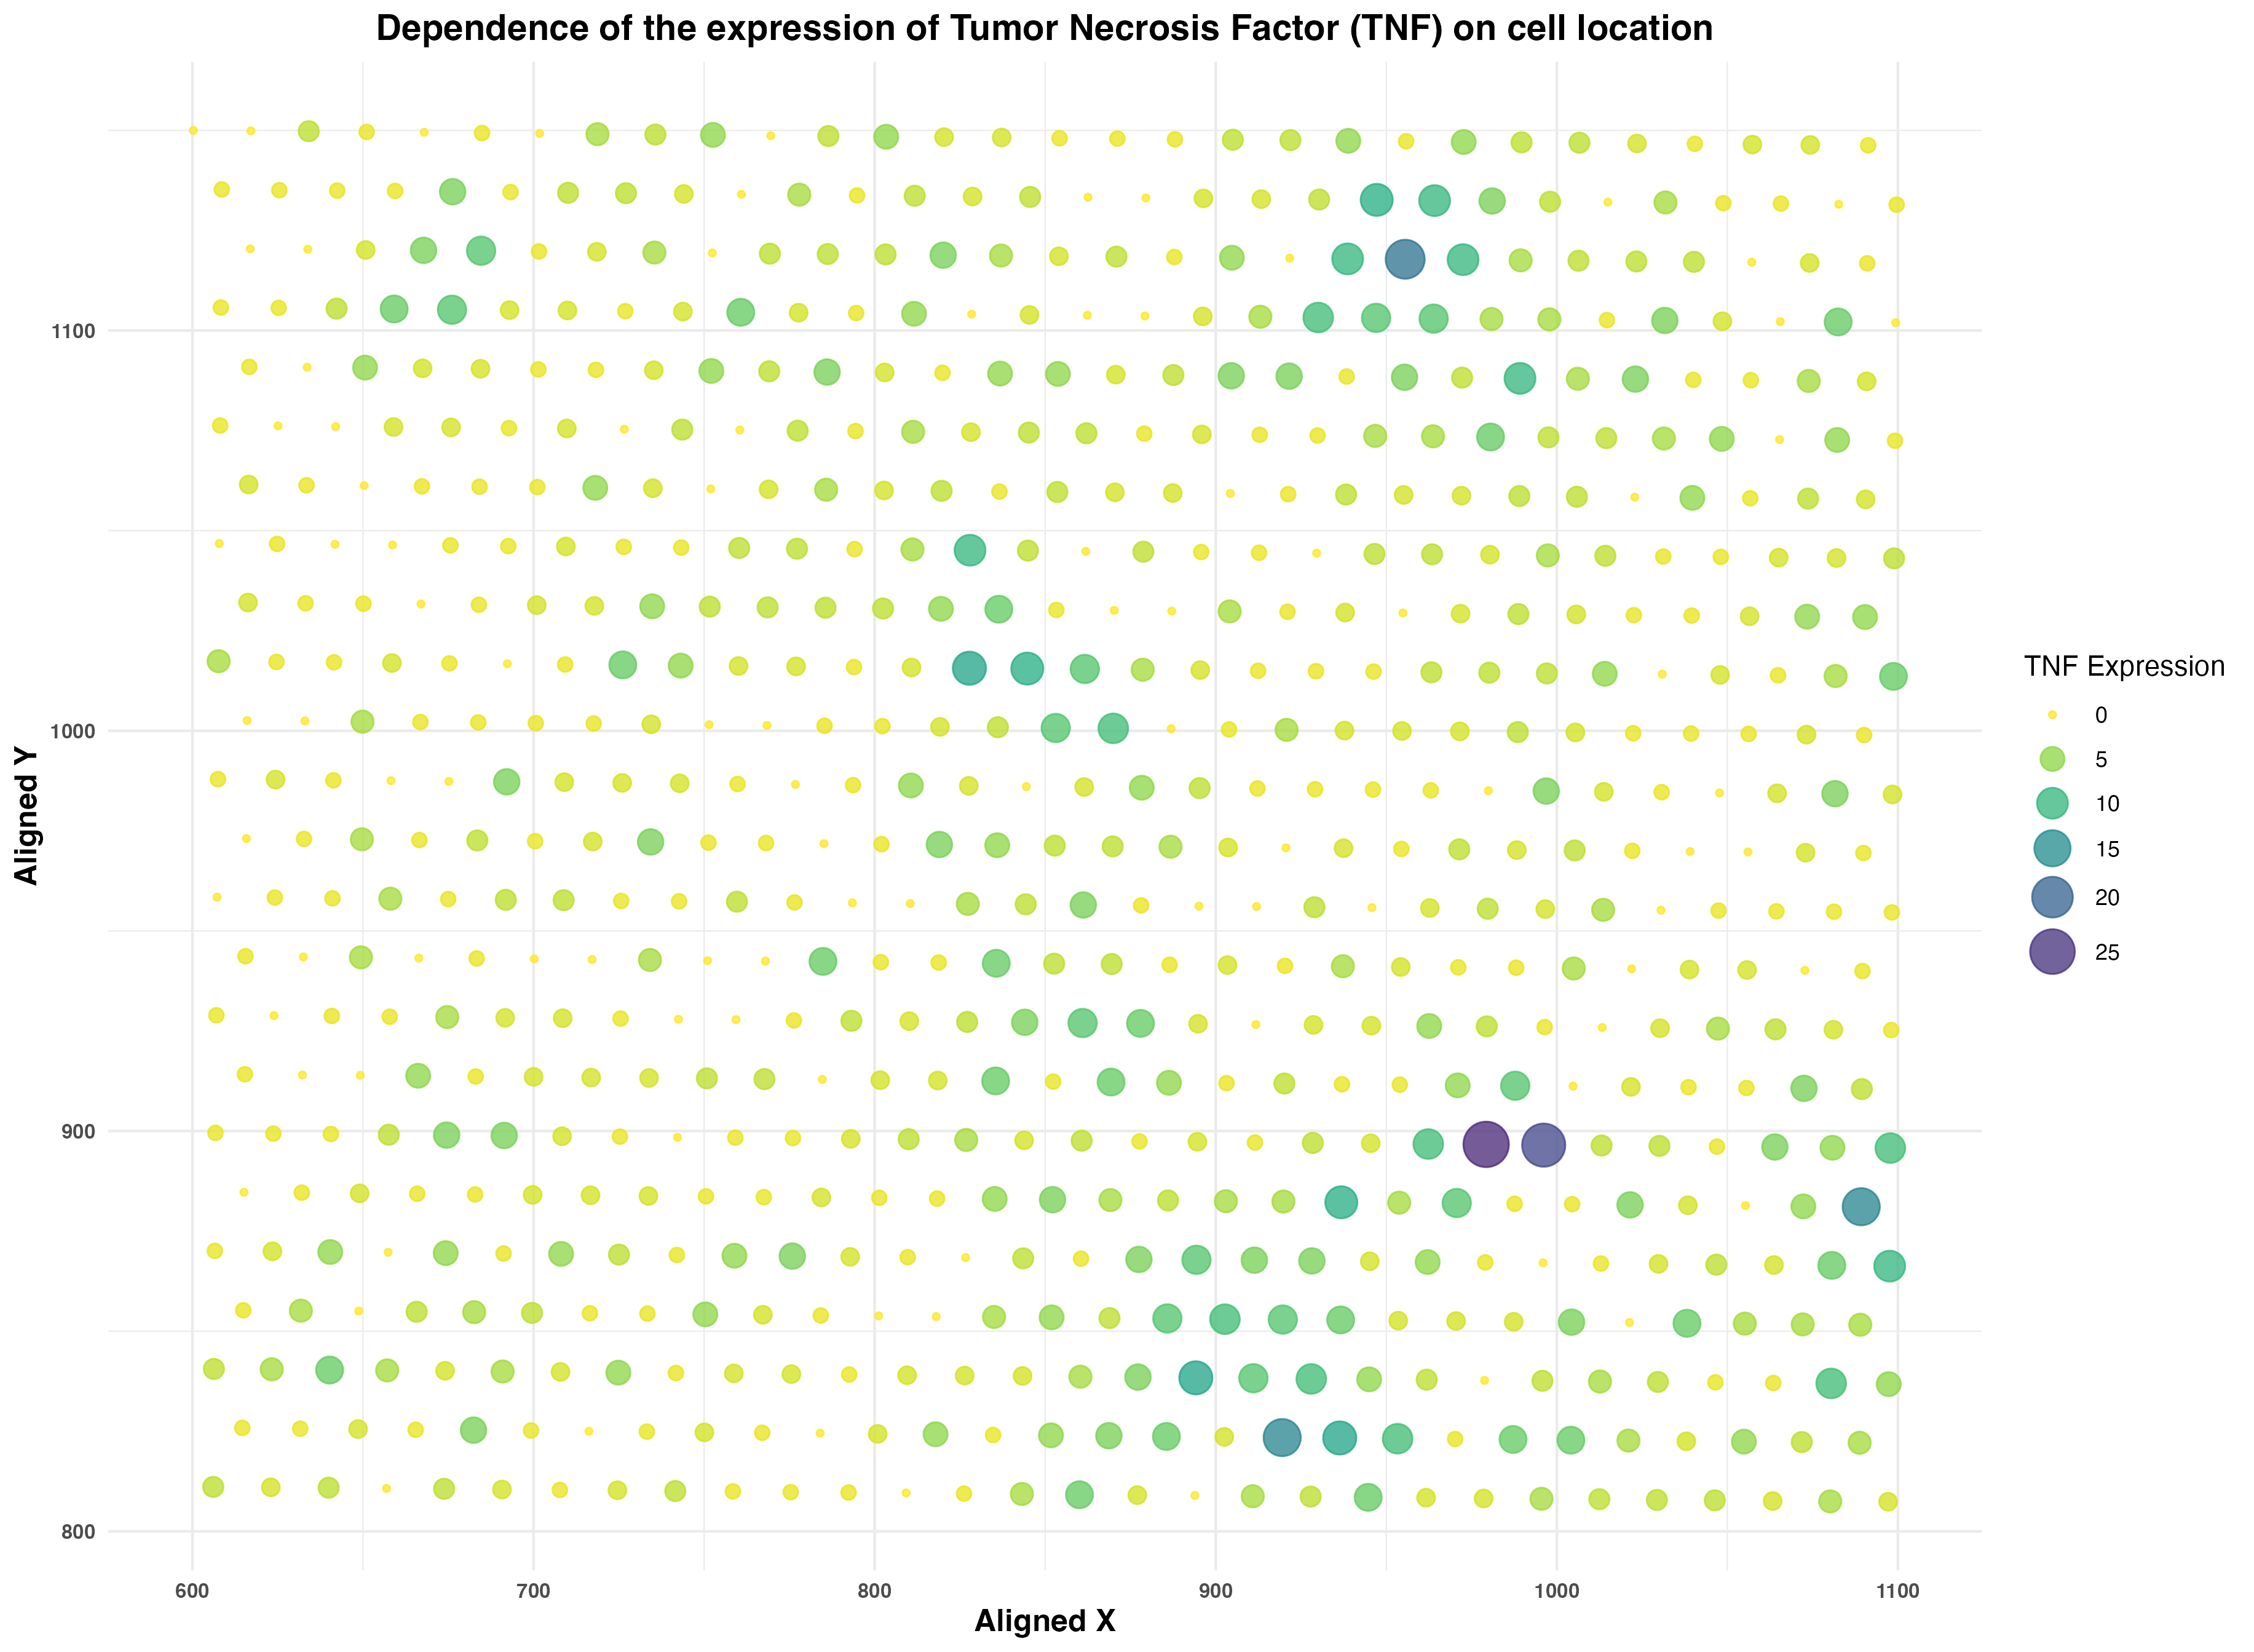
Dependence of the expression of Tumor Necrosis Factor (TNF) on cell location.
What data types are you visualizing?
TNF Gene Family: Catagorical TNF Expression: Quantitative X,Y Centroid Positions: Quantitative
I am visualizing the cumulative expression of all genes belonging to the Tumor Necrosis Factor (TNF) family in the Eevee data set. The TNF gene family is a catagorical data because the names of genes do not represent meaningful numerical values. These genes include TNFRSF9, TNFRSF18, TNFRSF4, TNFRSF25, TNFRSF8, and TNFRSF1B. The TNF expression a discrete, quantitative data with values representing the relative expression of TNF in each cell. The X,Y centroid positions encoded in aligned_x and aligned_y is a continous, quantitative data which is the position of the center of each cell relative to the others in the sample.
What data encodings (geometric primitives and visual channels) are you using to visualize these data types?
Geometric Principles: Points, Areas Visual Channels: Position, Size, Color (Hue and Saturation)
The visualization contains points that are indicative of each cell with a visual channel of position to represent the relative location of each cell in the sample. These include the X,Y centroid positions. I chose position because it allows for an immediate understanding of the spatial relationship expressed in the quantative data. TNF expression is encoded in two ways. First, the geometric principle of area and the visual channel of size represents the TNF expression of each cell with smaller area points having less TNF expression. Second, the visual channel of color through the use of the hue scale of inverted viridis also represents the TNF expression with more yellow points being low expression and more indigo cells having high TNF expression. I chose an inverted viridis because I wanted to have a clear distinction between large and small expression, and yellow is inherently a less perceivable hue compared to indigo, thus making it easier to see areas of high TNF expression. Finally, saturation is used for visibility purposes through the use of opacity.
What about the data are you trying to make salient through this data visualization?
My data visualization aims to highlight the spatial understanding of where tumor necrosis factors are expressed in the cell. Understanding the locations of expression and release of tumor necrosis factor pro-inflammatory cytokines can help in the creation of targeted treatments.
What Gestalt principles or knowledge about perceptiveness of visual encodings are you using to accomplish this?
Similarity: Points of similar size and color are percieved as being part of the same group, thus converying the similarity of their TNF expression.
Enclosure: The points representing cells are enclosed within the rectangular graph thus separating them from the text and the legend.
Proximity: Cells of similar colors in close proximity to each other are visual estimated as being part of a cluster. I predicted that there would be a spatial relationship between the TNF expression, so areas of high expression would appear more indigo and have cells larger in size.
data <- read.csv("/Users/knm/github/genomic-data-visualization-2024/data/eevee.csv.gz", row.names = 1)

tnf_family_genes <- c("TNFRSF9", "TNFRSF18", "TNFRSF4", "TNFRSF25", "TNFRSF8", "TNFRSF1B")
data$TNF_sum <- rowSums(data[, tnf_family_genes])

library(ggplot2)
library(viridis)
library(stringr)

plot_TNF <- ggplot(data) +
  geom_point(aes(x = aligned_x, y = aligned_y, col = TNF_sum, size = TNF_sum), alpha = 0.75) +
  scale_color_viridis(option = "D", direction = -1, begin = 0.1, end = 1) +
  scale_size_continuous(range = c(1, 8)) +
  theme_minimal() +
  theme(
    plot.title = element_text(face = "bold", size = 14, hjust = 0.5),
    axis.text = element_text(size = 8, face = "bold"),
    axis.title = element_text(size = 12, face = "bold")
  ) +
  labs(
    title = str_wrap("Dependence of the expression of Tumor Necrosis Factor (TNF) on cell location", 100),
    x = "Aligned X",
    y = "Aligned Y",
    color = "TNF Expression",
    size = "TNF Expression"
  ) +
  guides(color= guide_legend(), size=guide_legend())

ggsave("hw1_kmukund1.png", plot = plot_TNF)