Centroid positions, cell and nucleus areas of each cell

Whose code are you applying? Provide a JHED
kbowden5
Critique the resulting visualization when applied to your data.
Do you think the author was effective in making salient the point they said they wanted to make?
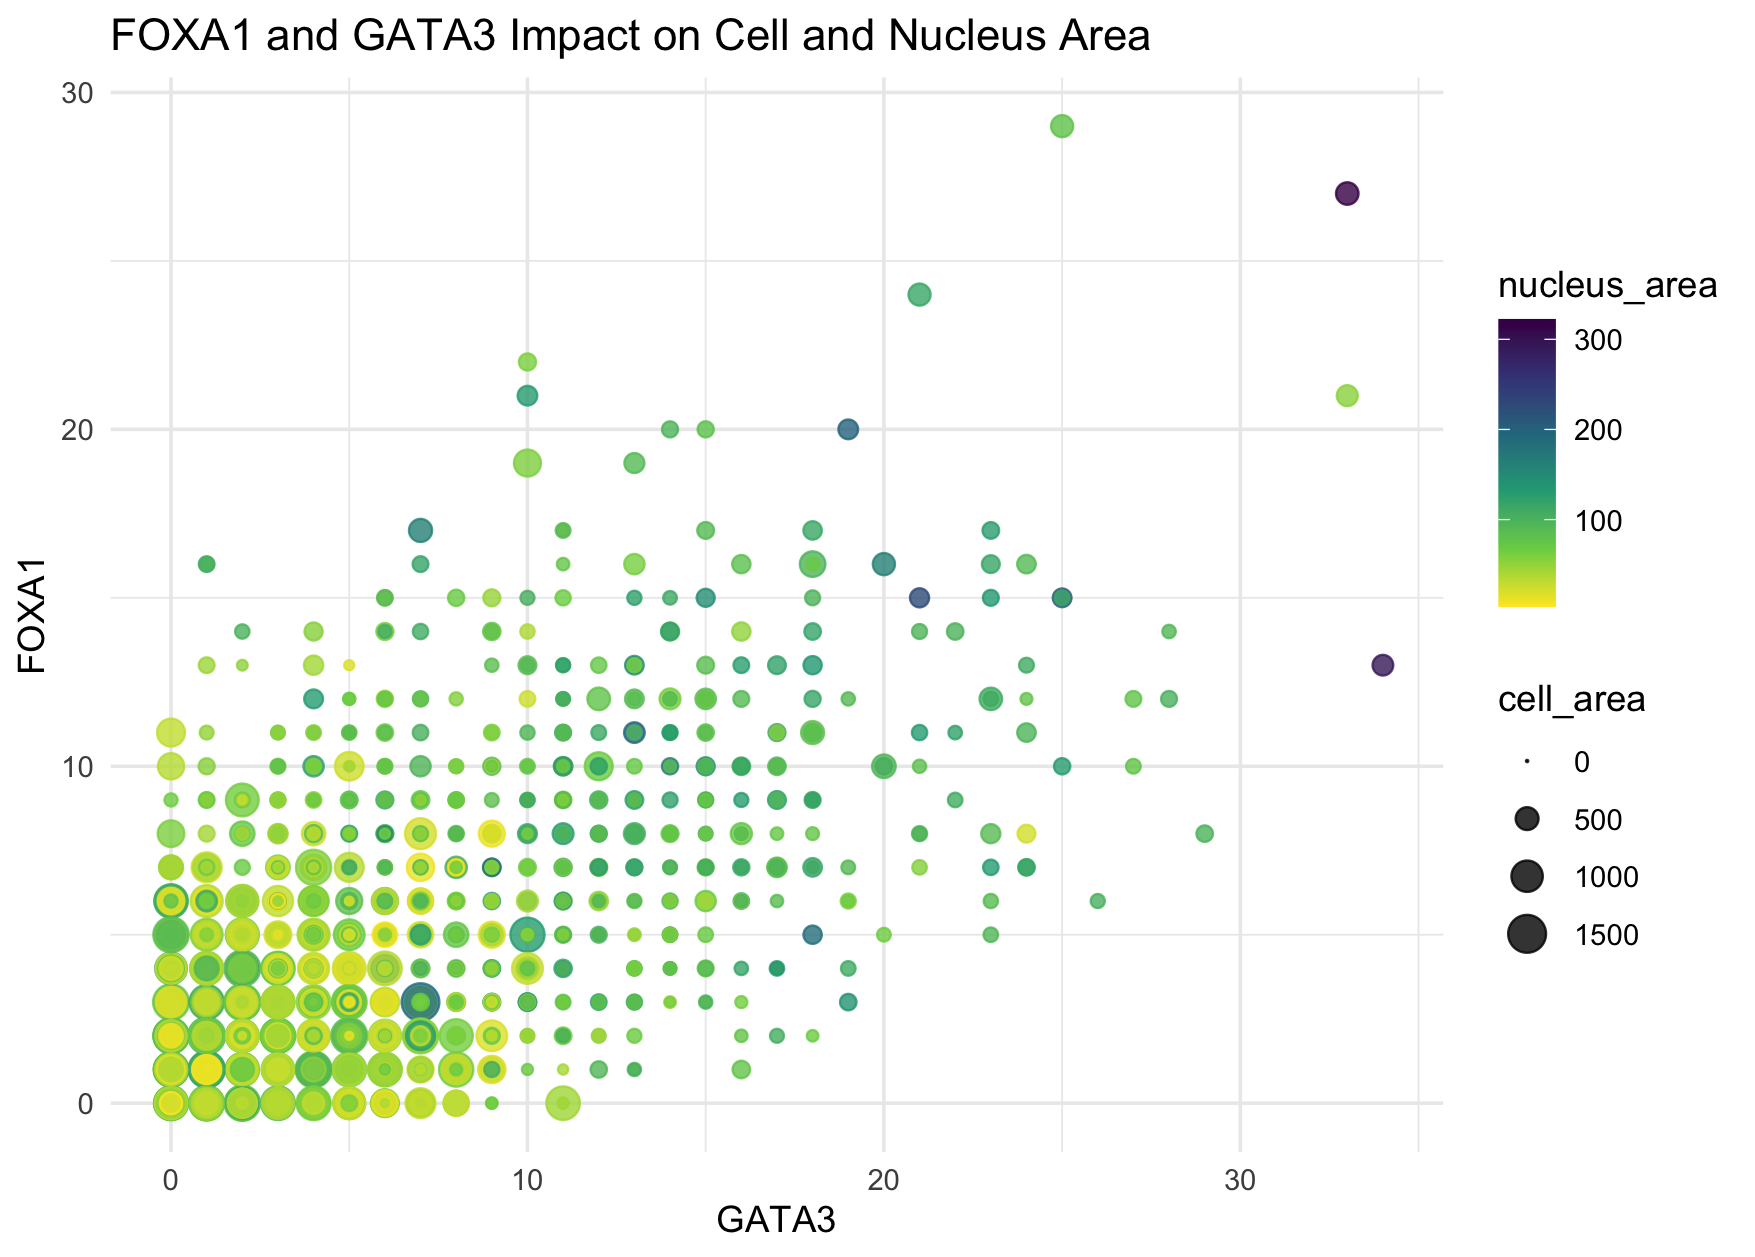
I think the author was quite effective in making salient the relationship between two transcript factors expression, cell area, and nucleus areas. We can easily tell from the plot some data points with lighter colors shown at the top right corner where both expression levels are very high. The author applied the Gestalt principle, similarity, to demonstrate cells with similar nucleus area using similar colors.
How could you improve the data visualization in making salient the point they said they wanted to make? If you don’t think the data visualization can be improved, explain why the data visualization is already effective.
I think one minor aspect that could be improved through reverting the order of color hue and opacity of data points is the trend of larger nucleus area at higher expression level. Previously, the author used full opacity (alpha = 1 which is the default) and the default scale of viridis color palette (from light yellow to dark purple). We can easily spot the “outlier” in yellow but all the purple ones kind of mix together. By reverting the color scale and reducing the opacity a bit, we can tell from the plot that the left bottom cluster seems to be more yellow (i.e., cells with both expression levels low), the middle cluster seems to be more green/blue, and the top right outliers to be more dark blue/purple (i.e., cells with both expression levels high). I personally prefer this reversed viridis scale.
Please share the code you used to reproduce this data visualization.
data <- read.csv('pikachu.csv.gz', row.names = 1)
library(ggplot2)

ggplot(data)+
  geom_point(aes(x=GATA3, y = FOXA1, col = nucleus_area, size = cell_area), alpha=0.8)+
  scale_color_viridis_c(direction=-1)+
  scale_size(range=c(0,5), limits = c(0,1500)) +
  theme_minimal()+
  labs(title = "FOXA1 and GATA3 Impact on Cell and Nucleus Area",
       x = "GATA3",
       y = "FOXA1")