Centroid positions, cell and nucleus areas of each cell

What data types are you visualizing?
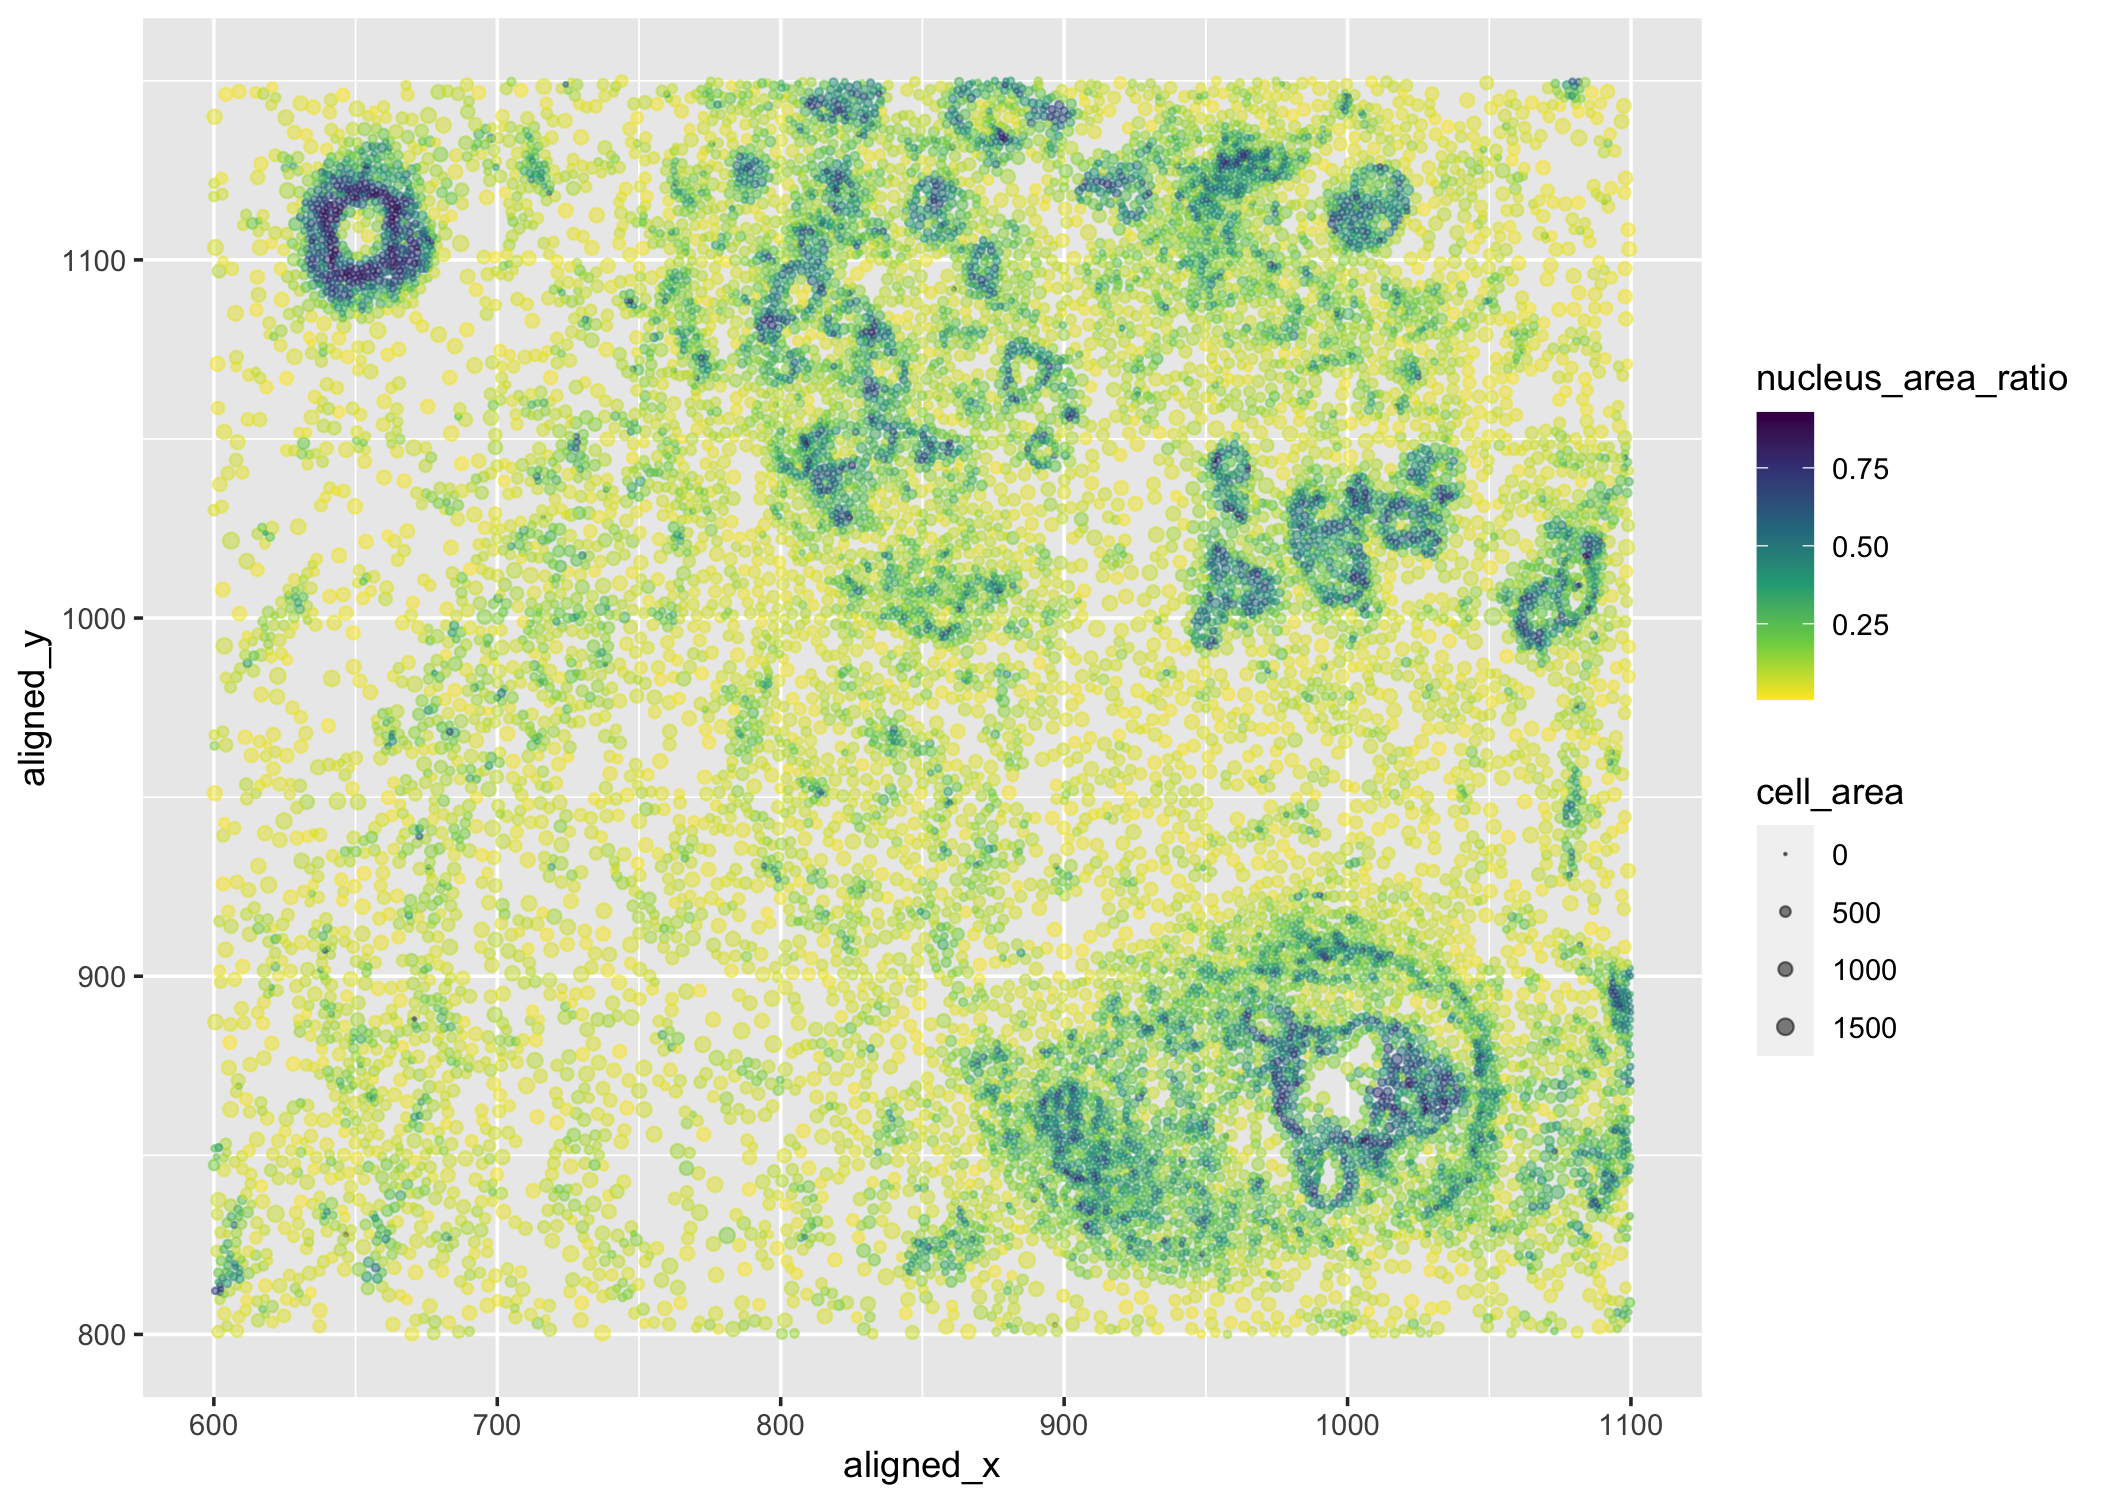
I am visualizing quantitative data of the ratio of nucleus area to cell area for each cell, quantitative data of the area for each cell, and spatial data regarding the x,y centroid positions for each cell.
What data encodings are you using to visualize these data types?
I am using the geometric primitive of points to represent each cell. To encode the ratio of nucleus area to cell area, I am using the visual channel of color hue. To encode the area for each cell, I am using the visual channel of size. To encode the spatial x,y position, I am using the visual channel of position along the x,y axis.
What type of data visualization is this? What about the data are you trying to make salient through this data visualization? What Gestalt principles have you applied towards achieving this goal if any?
My explanatory data visualization seeks to make more salient the relationship between spatial position and the ratio of nucleus area to cell area. for Gestalt principles, I have used similarity by representing cells with similar ratio of nucleus area to cell area.
Please share the code you used to reproduce this data visualization.
data <- read.csv('./Documents/JHU/genomic data viz/pikachu.csv.gz', row.names = 1)
library(ggplot2)
data$nucleus_area_ratio = data$nucleus_area/data$cell_area
ggplot(data) +
  geom_point(aes(x = aligned_x, y = aligned_y, color=nucleus_area_ratio, size=cell_area), alpha=0.5) +
  scale_size(range=c(0,2), limits = c(0,1500)) +
  scale_color_continuous(type="viridis", direction=-1)