Frequency of Most Expressed Gene in a Spot

What data types are you visualizing?
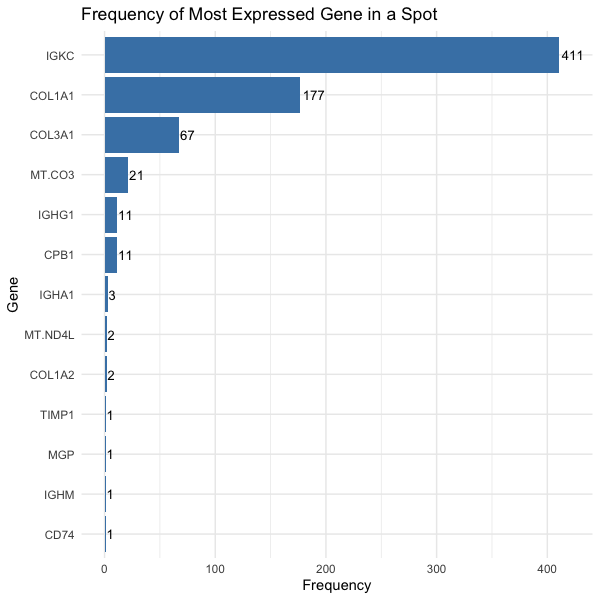
We are visualizing quantitative data, the number of spots in which the gene is most expressed, and categorical data, the gene.
What data encodings (geometric primitives and visual channels) are you using to visualize these data types?
We are using the geometric primitive of line to encode the quantitative data. We are using the visual channels of y-position to encode the quantitative data and x-position to encode the categorical data.
What about the data are you trying to make salient through this data visualization?
We would like to make salient which genes are most commonly expressed throughout all the spots.
What Gestalt principles or knowledge about perceptiveness of visual encodings are you using to accomplish this?
We used position to encode the quantitative and categorical data since it offers the most saliency for these types of data.
library(ggplot2)
data<-read.csv('eevee.csv.gz',row.names=1)
exp2<-data %>% select(-c('barcode','aligned_x', 'aligned_y'))
exp2$max_gene<-colnames(exp2)[apply(exp2,1,which.max)]
c<-as.data.frame(table(exp2$max_gene))
names(c)[names(c) == 'Var1'] <- 'Gene'
names(c)[names(c) == 'Freq'] <- 'Frequency'
ggplot(data=c,aes(x=reorder(Gene, Frequency),y=Frequency))+
  geom_bar(stat="identity", fill="steelblue")+
  geom_text(aes(label=Frequency), hjust=-.1, size=3.5)+theme_minimal()+
  coord_flip()+
  labs(title="Frequency of Most Expressed Gene in a Spot",x ="Gene", y = "Frequency")+ylim(0,420)